Market Analysis 29 May – 4 June: BTC Breaks Below Support & BAYC Hacked

The price of Bitcoin and altcoins is prone to volatile swings, with daily prices that can increase or decrease by up to 20%. Not only that, as a relatively new industry, crypto technology is developing at a rapid pace, with numerous new projects being created on a regular basis. Through Market Analysis provided by Pintu’s team of traders, you can study Bitcoin and altcoins price volatility, as well as find out the latest updates in the industry. Read the full analysis here.
BTC Price 31 May-6 June
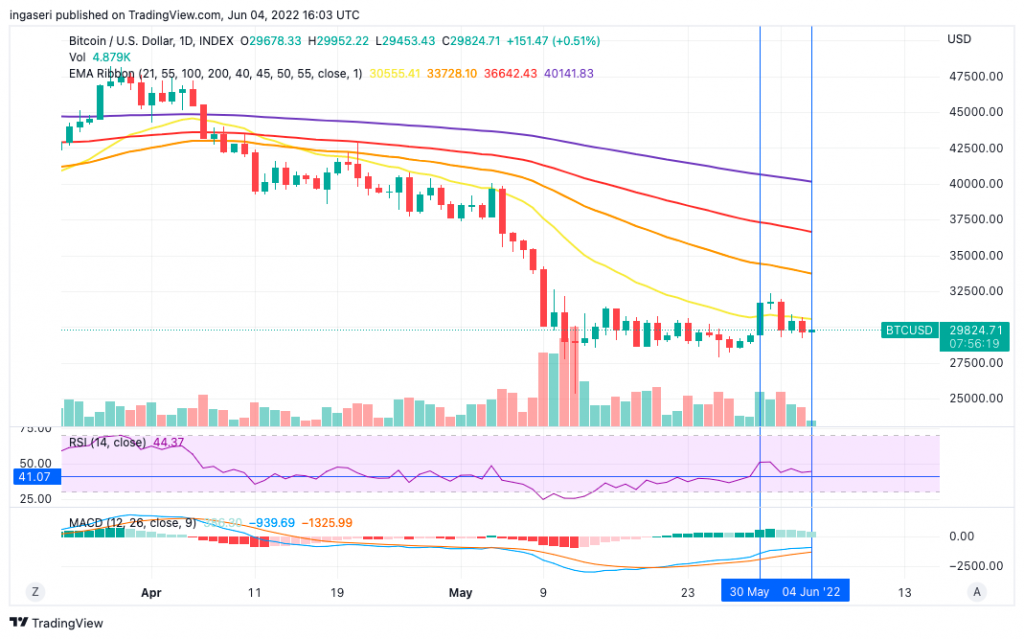
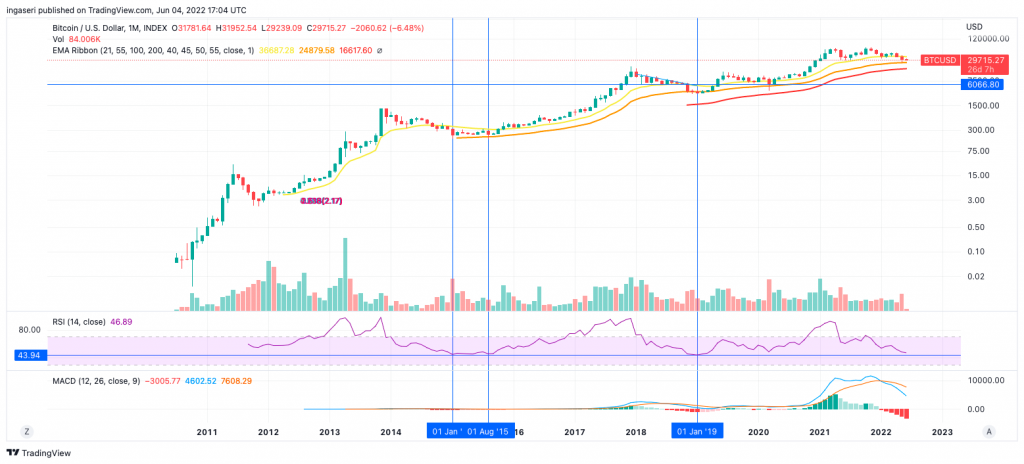
Over the past week, we saw a relief rally or pause from selling pressure that pushed the price of BTC up to around $32,000, before settling below $30,000 as of June 4, 2022. As can be seen in the chart below, at one point, BTC was above the 21-day EMA (yellow line) before going back down and making the 21 EMA a resistance level.
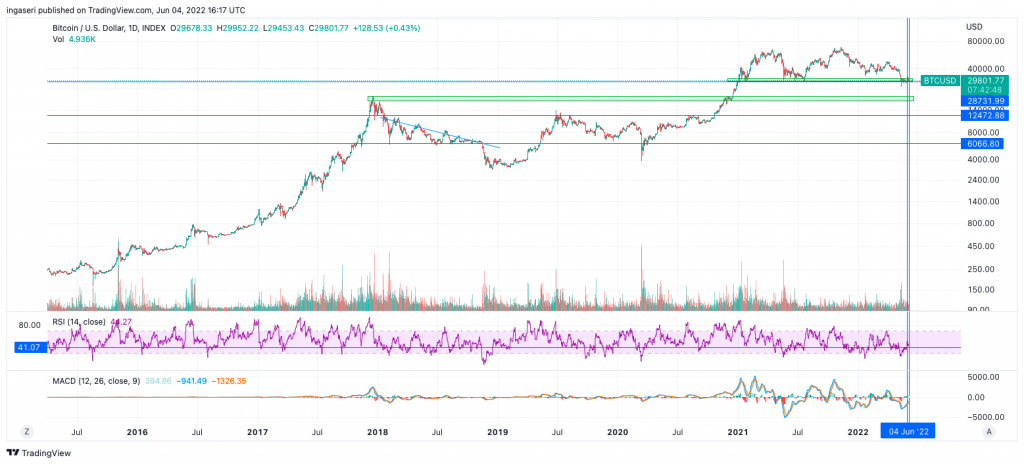
Furthermore, if we look at the long-term conditions as in the chart below, it can be seen that BTC has strong support at US$28,000-30,000. If BTC is able to break through this price range, BTC may break down to the US$20,000 price level which was the previous support level, and then to a lower level, which is around US$12,000.
In May, Bitcoin’s monthly chart closed below the bottom of the channel, in the range of US$33,000. Notice how the US$33,000 had been a key support level the previous month in the chart below. In this price range, it was confirmed that BTC had broken through the support level, and with the relief rally, BTC was trying to rise back to that level and then made it a resistance level.
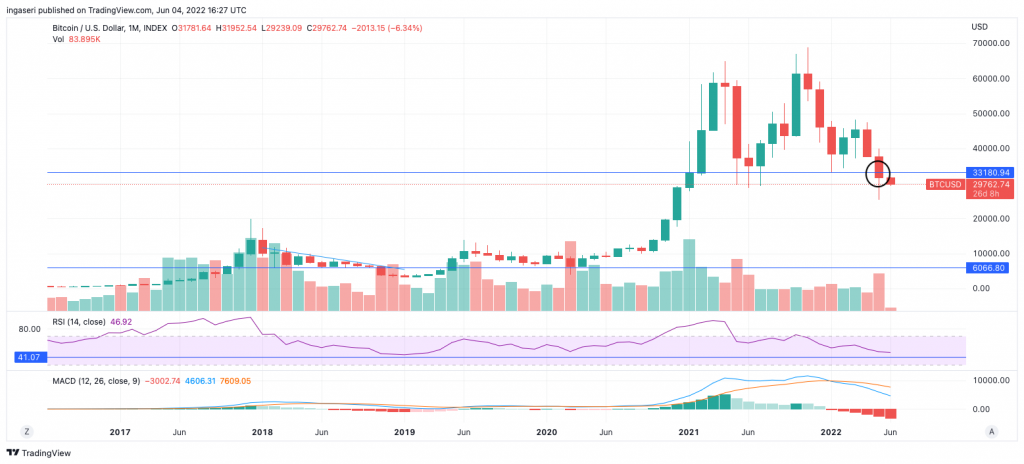
Notice how BTC was moving sideways as seen below, with US$32,000 as the first resistance level and US$35,000 as the second resistance. Chances are we won’t see a meaningful reversal until BTC breaks those two resistance levels, and returns above the 21-month EMA level (yellow line).
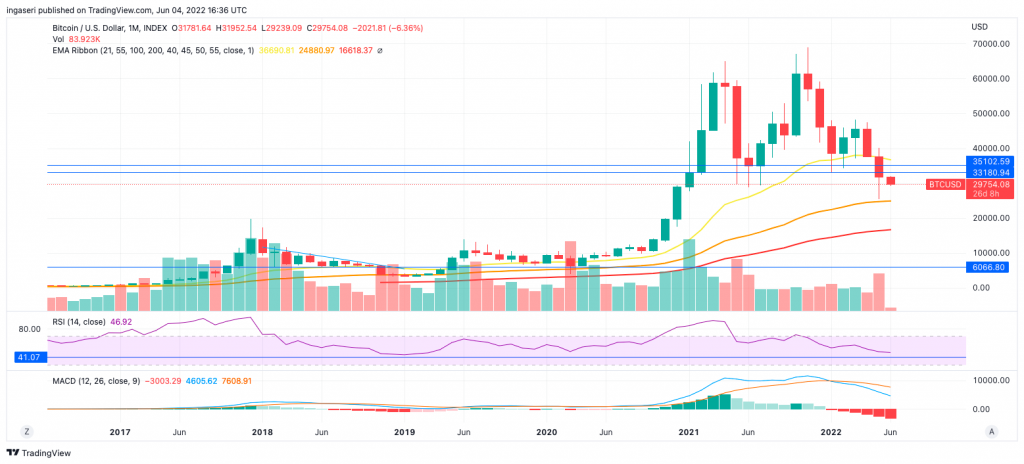
Let’s take a look at the monthly RSI (chart below), noting that on the previous 3 occasions, BTC price bottomed out as the RSI bottomed out at 44 on each cycle. Currently, the RSI is at 47.69. Also, notice how several times BTC touched the 55-month EMA (orange line).
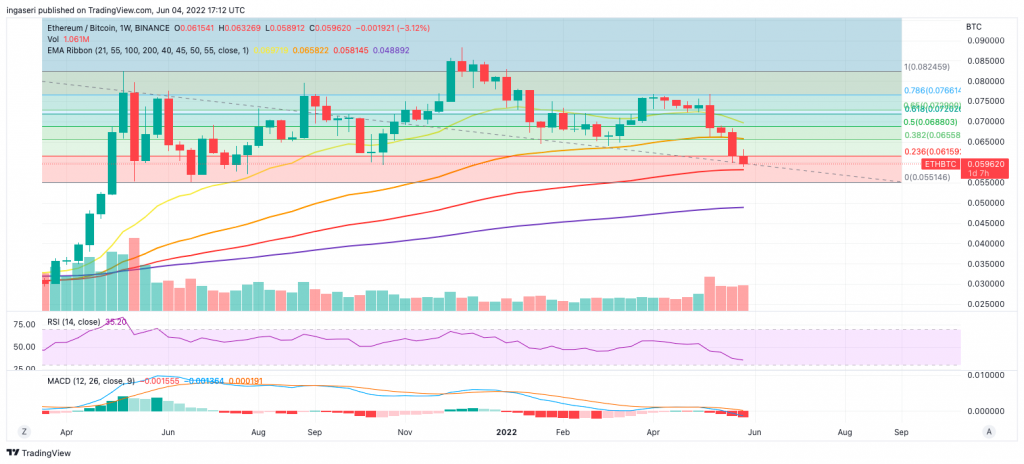
Last week after we saw ETH/BTC break through the 55-week EMA support, it can be seen how ETH/BTC easily fell and broke its strong support at the 0.236 Fibonacci retracement support line. What was previously a support line has now become resistance. Expect further declines from ETH, given the very weak sentiment for ETH altogether.
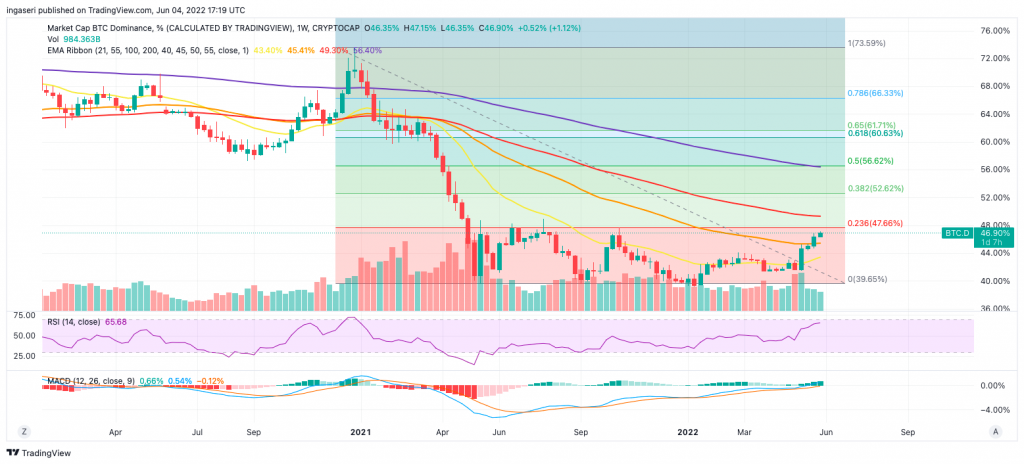
Meanwhile, BTC Dominance recorded a green candle for the 4th week in a row. BTC.D has gained 13.5% over the last 4 weeks. This shows that Bitcoin represents 47% of the overall crypto market share. The increase in BTC.D can be interpreted as a flow of liquidity back into BTC from altcoins after we see a more dispersed liquidity allocation in the 2021 bull run period.
This is a healthy sign to allow for a good run for the next bull run until we see liquidity dispersion again, at which point the market dilutes as products and altcoins appear to outpace capital inflows to support the dispersion.
Read also: 4 Crypto Trading Indicators You Should Know
On-Chain Analysis
- Reserve or reserves on all exchanges remain at the lowest level in more than 3 years. There is an increasing trend on the Spot Exchange (spot exchange), but the reserves are still the lowest for the last 3 years. Reserves on the Derivative Exchange decreased after the price adjustment. There has been a slight increase in fund holdings driven by the Canadian Purpose Bitcoin ETF. Meanwhile, whales and miners are still in a hold position.
- The amount of BTC transferred to the Derivative Exchange is still high. Negative sentiment is slightly stronger along with futures investors. Open interest is at the same level as last week and the estimated value of the leverage ratio remains above the previous high. Both short-term and long-term investors sell at a loss.
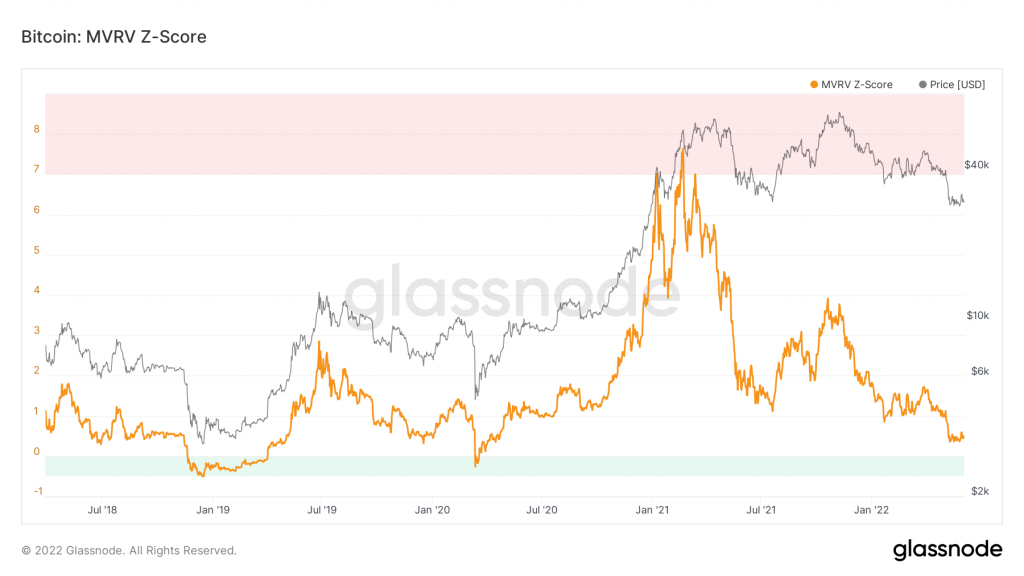
- The NUPL (Net Unrealized Profit/Loss) indicator indicates that the Bitcoin price is currently approaching an undervalued position. Also pay attention to the MVRV-Z Score which goes into the green zone. MVRV Z-Score is another indicator that is used to assess when Bitcoin is relatively over/undervalued to the “price it should be”. When the market value is significantly higher than the realized value, historically it indicates a market peak (red zone), whereas the opposite has indicated a market bottom (green zone). Technically, the MVRV Z-Score is defined as the ratio between the difference between market capitalization and realized capitalization, and the standard deviation of all historical market capitalization data, i.e. (market capitalization – realized capitalization) / std (market capitalization).
Read also: What Is On-Chain Analysis in Crypto?
About Altcoins
- 📉 Backed by a higher percentage decline in ETH than BTC, we can see red in all altcoins. BNB, ADA, XRP, DOGE, DOT, AVAX, and SHIBA are all down.
- 🚨 However, SOL and TRX experienced the most substantial daily declines. Last week Solana experienced network problems, which caused the price of SOL tokens to drop by around 8%. Quoting Coindesk, Solana’s network was disrupted for more than four hours due to a bug in one blockchain procedure for processing a special type of transaction designed for an offline use case.
- ⚠ The overall market cap of crypto has decreased to 1.22 trillion US dollars. In the last three days, the crypto market lost around 100 billion US dollars in market cap.
Market Analysis Summary
- 📈 There was a relief rally earlier in the week, pushing the BTC price up to $32,000 before settling below $30,000.
- 📊 In May 2022, BTC closed below support levels in the range of 28,000-30,000 US dollars, with resistance at 32,000-35,000 US dollars.
- 🟩 BTC Dominance recorded a green candle for the 4th week in a row. This means there is a flow of liquidity back into BTC from the altcoins after we see a more dispersed liquidity allocation in the 2021 bull run.
- 💰 Leverage increases in line with the continuing sideways price action.
- 📉 Overall, the crypto market cap has decreased to a level of 1.2 trillion US dollars.
Other News About Crypto
- 🙈 Yuga Labs Discord Server Hacked; 200 ETH worth of NFT Stolen. Bored Ape Yacht Club’s (BAYC) Discord account was hacked on Saturday, with attackers earning 200 ETH worth of NFT ($360,000), according to Yuga Labs. Citing Coindesk, the hack occurred after the account of BAYC project community manager, Boris Vagner, was taken over and then used by attackers to post phishing links on the official BAYC channel and a related metaverse project called Otherside. News of the hack was first reported by Twitter user NFTherder, who also estimated that 145 ETH (about US$260,000) had been stolen along with the NFTs, with the stolen funds going into four separate wallets.
- 👟 Stepn’s ‘Move-to-Earn’ Game Hit by DDOS Attack. Popular crypto game Stepn, which uses NFT on blockchain Solana, was hit by a number of distributed denial-of-service (DDoS) attacks last weekend. Users were informed that the game experienced “network congestion” after being hit by 25 million DDoS attacks in a short period of time. A DDoS attack is when someone tries to bring down a website by overloading it with traffic or unreal user traffic. Attacks like this are very common, especially in the crypto world.
References
- Eli Tan, Yuga Labs Confirms Discord Server Hack; 200 ETH Worth of NFTs Stolen, Coindesk, accessed on 5 June 2022
- Danny Nelson, Solana Halted by Bug Linked to Certain Cold Storage Transactions, Coindesk, accessed on 5 June 2022
- Mat Di Salvo, ‘Move-to-Earn’ Game Stepn Hit With DDOS Attacks—Again, Decrypt, accessed on 6 June 2022
Share