Market Analysis, December 25, 2022: Stock Market Crash, BTC Hits Its Resistance

Market analysis crypto
The stock market sold off at the beginning of the week due to concerns about a potential recession. Meanwhile, in the crypto market, BTC hits 21 days EMA as a resistance.
Pintu’s trader team has collected various important data about macroeconomic analysis and crypto market movement over the past week which is summarized in this Market Analysis. However, you should note that all information in this Market Analysis is for educational purposes, not financial advice. Find out the full analysis in the following article.
Article Summary
- 🢠The jobless claims and GDP data signal the Fed may have to stay tough on rates.
- 🚨 The crypto market is still feeling uneasy with multiple uncertainties such as the looming recession, the expected tougher regulation post-FTX turmoil, and the continuing Binance FUD that’s been going around.
- 💡 BTC hits 21 days EMA as a resistance. On the weekly chart, BTC is still on the falling wedge pattern formation.
- 📉 On the weekly chart, ETH is still following its descending triangle formation.
Macroeconomic Analysis
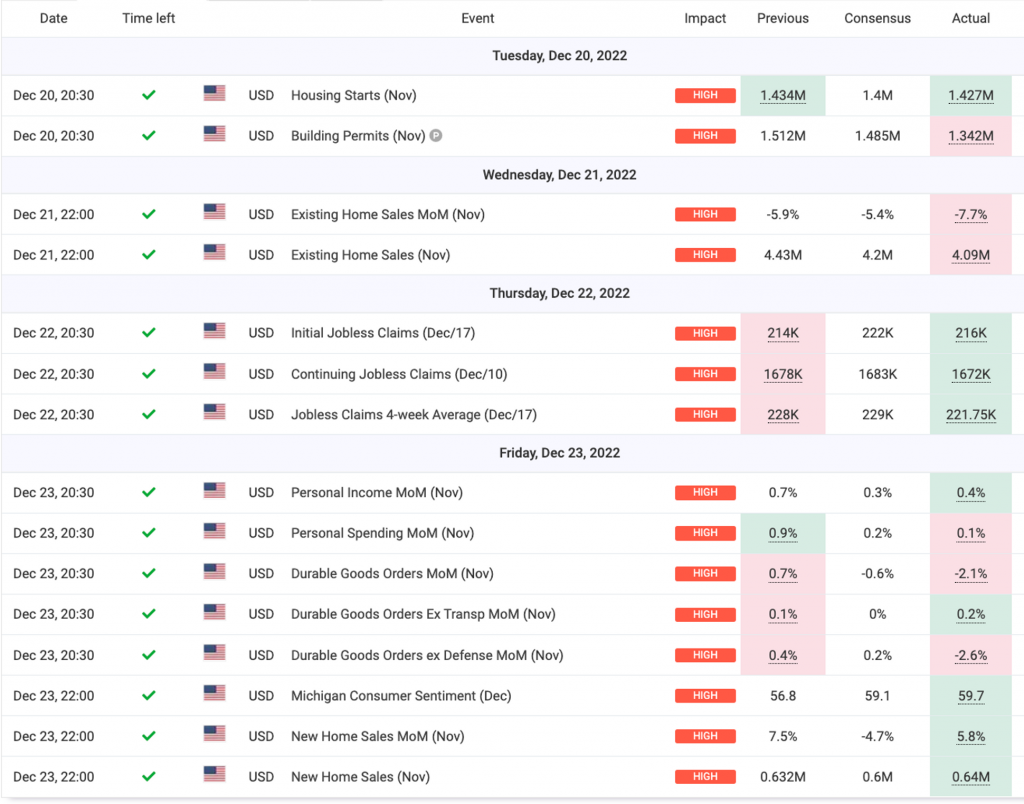
Earlier in the week, the news of incoming recession is looming over the markets. The jobless claims and GDP data signal the Fed may have to stay tough on rates. The government’s 3rd estimate of GDP is typically a nonevent, but the Final Q3 GDP rose 3.2%, from its previous 2.9%. usually, this would indicate good news, but during such times of rising inflation, it begs the question of whether the Fed is not doing its best to curb the stronger-than-expected growth and inflation.
The initial jobless claims for the week were low. They have been hovering in that range since May, a sign of the labor market is still not cooling down.
block-preformatted">Initial Jobless Claims measures the number of individuals who filed for unemployment insurance for the first time during the past week.
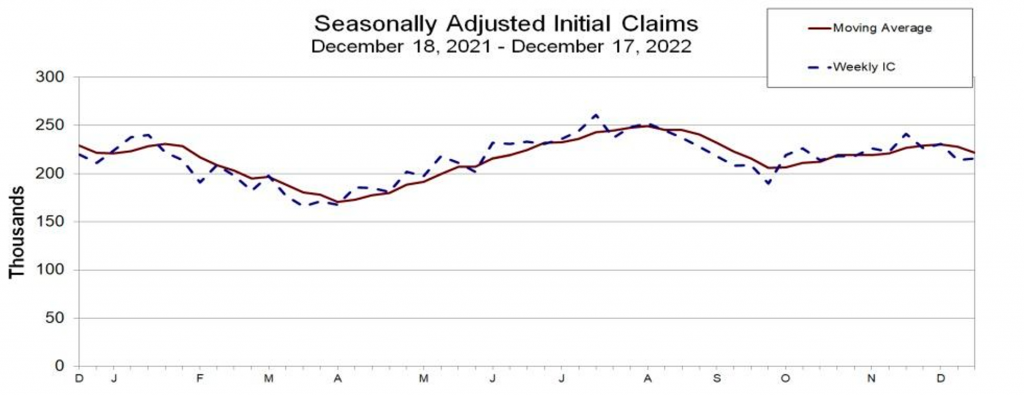
All the above economic indicators seemed to support the hard-landing scenario. The stock market sold off early in the week, fearing the looming recession and we see further sold off towards the end of the week upon hearing the labor market remains tight, raising fears of higher and longer Fed rate hiking.
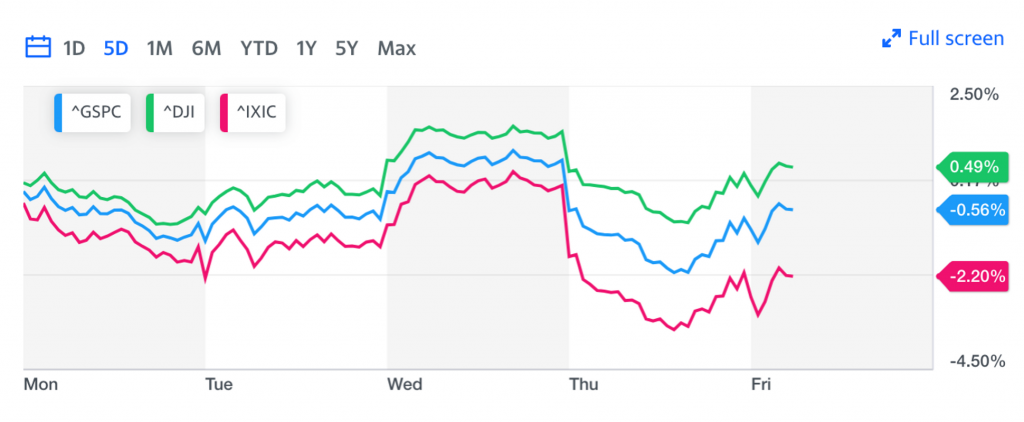
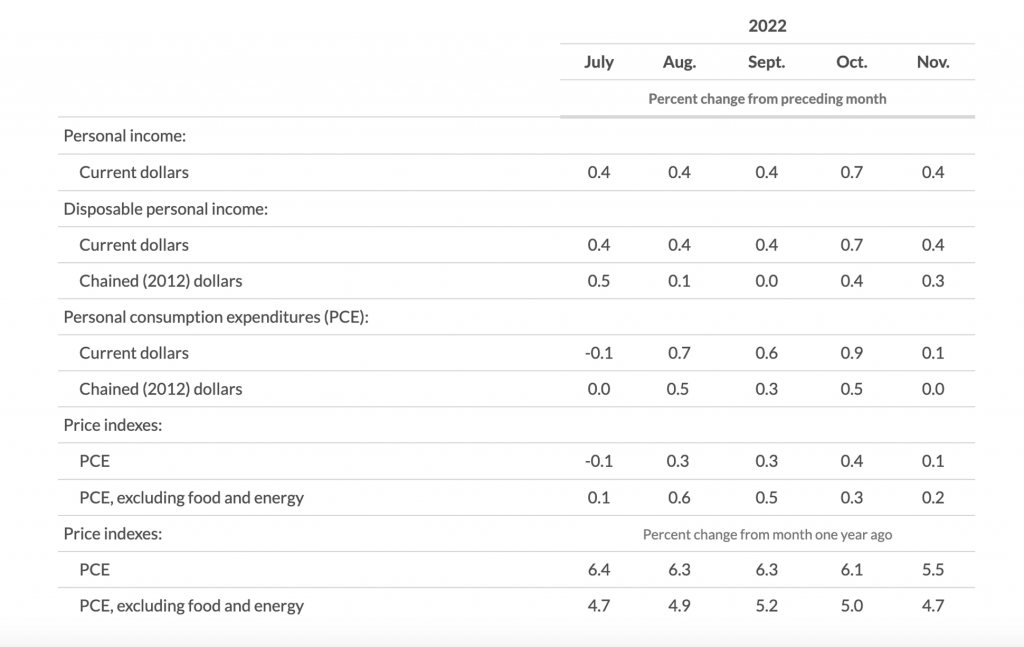
Towards the end of the week, however, we can see the market bounced. On Friday, The Bureau of Economic Analysis of the United States Department of Commerce announced that personal income increased by $80.1 billion in November (+0.4% M/M vs +0.3% expected and +0.7% prior).
Disposable personal income (DPI) increased by $68.6 billion (0.4%) and personal consumption expenditures (PCE) increased by $19.8 billion (0.1%). Real DPI increased 0.3 percent in November and real PCE increased less than 0.1%
The PCE price index increased by 0.1 percent. (+0.1% ****M/M vs +0.2% expected and +0.4% prior, +5.5%, Y/Y vs +5.5% expected and 6.1% prior).
Excluding food and energy, the core PCE price index increased 0.2 percent. (+0.2% M/M vs. +0.2% expected and +0.3% prior, +4.7% Y/Y vs. +4.6% expected and +5.0% prior). The core PCE is the Fed’s favorite tool to measure inflation. It has continued to cool off, giving the market a good indication that the inflation might have peaked.
Economic indicators throughout the week:
BTC Price Analysis
The crypto market is still feeling uneasy with multiple uncertainties. First is the looming recession. Second is the expected tougher regulation post-FTX turmoil. The third is the continuing Binance FUD that’s been going around.
FUD stands for Fear, Uncertainty, and Doubt, which is a strategy that aims to discredit the value of digital assets by spreading misinformation.
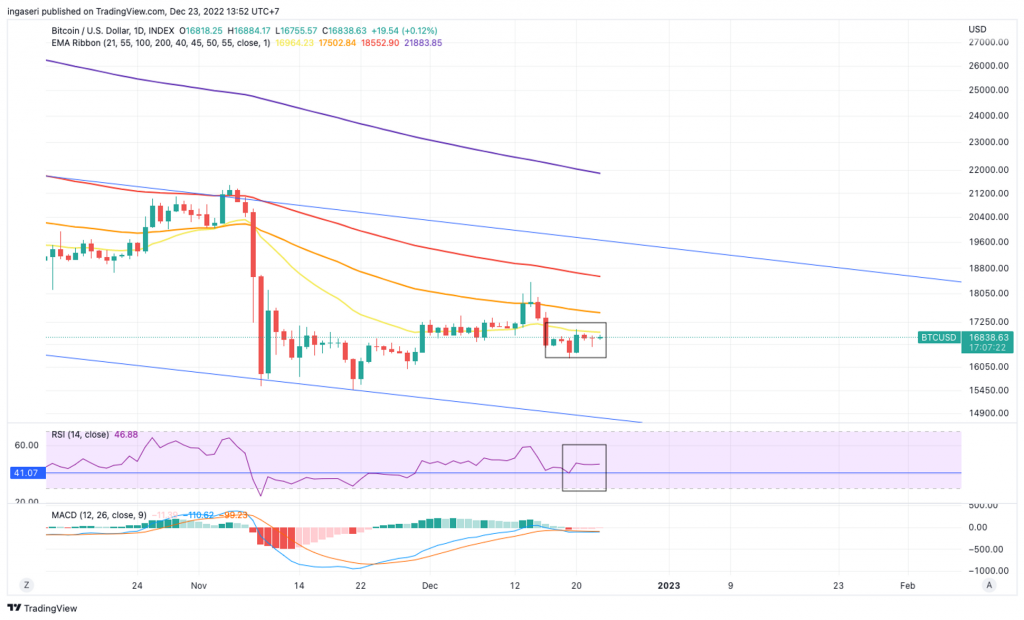
Looking at the BTC daily chart, we have made the 21 days EMA as a resistance, it has been 4 days that we are under the line. Resistance at 17,000. Notice that earlier in the week, RSI touched its support line and we can see a bounce in the price action.
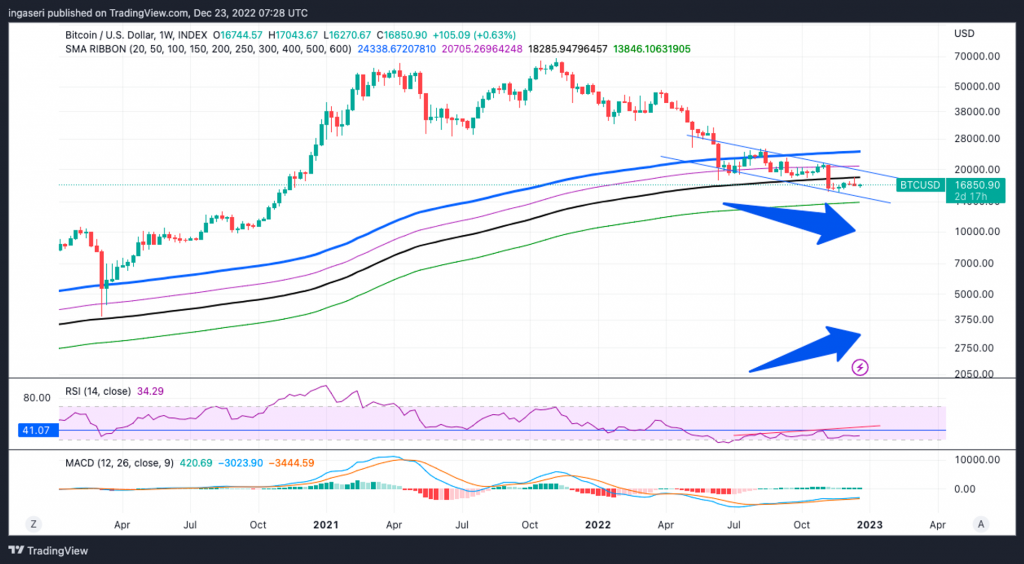
On a longer term basis, we are still on the falling wedge pattern formation. There is a hidden bearish divergence, notice the descending wedge and ascending RSI. This occurs when the price makes a lower high, but the RSI oscillator is making a higher high. Chances are that the price action will continue to shoot lower and continue the downtrend.
Also, take notice that the current price action is resisted at the 300 weeks moving average. BTC’s price seems likely to retest the $18K level (the 300 weeks moving average) and $19K level (the upper bound of the channel) and form another bearish leg toward the $15K level. Considering the overall market sentiment and the bearish price action signs, rejection from the top trend line and another cascade are probable.
ETH Price Analysis
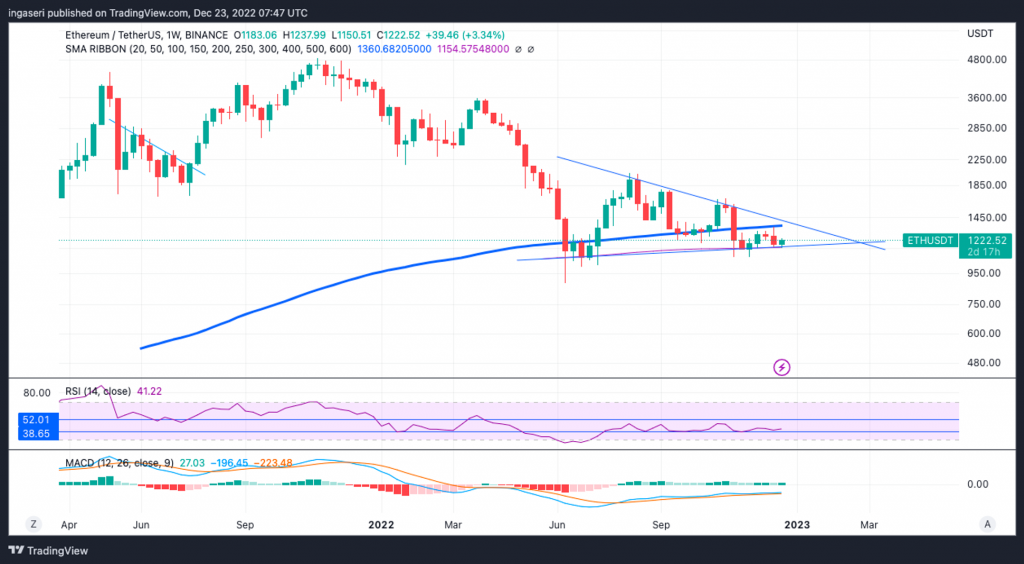
On the weekly chart, ETH is still following its descending triangle formation. This formation has an equal chance of breaking towards the downside or breaking towards the upside. The current price action however, suggested that we stay between the 400 week and 250 weeks moving average. The RSI level is staying within its support level, we have to be cautious once it breaks below the support line, we might enter a breakdown.
On-Chain Analysis:
📊 Exchange: As the exchange reserve continues to fall, it indicates lower selling pressure. Net deposits on exchanges are high compared to the 7-day average. Higher deposits can be interpreted as higher selling pressure.
💻 Miners: Miners’ are selling holdings in a moderate range compared to its one-year average. Miner’s revenue is in a moderate range, compared to its one-year average.
🔗 On-chain: More investors are selling at a loss. In the middle of a bear market, it can indicate a market bottom. Long term holders’ movement in the last 7days were lower than the average. They have a motive to hold their coins. Investors are in a capitulation phase where they are currently facing unrealized losses. It indicates the decreasing motive to realize loss which leads to a decrease in sell pressure.
🏦Derivatives: Long position traders are dominant and are willing to pay to short traders. Buying sentiment is dominant in the derivatives market. More buy orders are filled by takers. As open interest decreases, it indicates investors are closing futures positions and possibility of trend reversals. In turn, this might trigger the possibility of long/short-squeeze caused by sudden price movement or vice versa.
Altcoin News
- Former president Donald Trump released a collection card of 45.000 NFT: The tokens minted on Polygon, cost 99 US dollars and sold out in less than a day. The NFT holders automatically enter into a Trump Sweepstakes to win one of thousands prizes experiences with Trump, including a golf game, a gala dinner, and access to meet and greet events with President Trump.
- Uniswap partners with MoonPay to support bank transfer: MoonPay is a financial technology company that builds payments infrastructure for crypto. The partnership enables Uniswap users to purchase crypto assets using debit card, credit card, or bank transfers. The available crypto assets are DAI, ETH, MATIC, USDC, USDT, WBTC, and WETH.
More News from Crypto World in the Last Week
- Sam Bankman-Fried was released on $250 million bail. The founder and the CEO of FTX, Sam Bankman-Fried was released while awaiting trial for fraud and other criminal charges. However, he would also be required to wear an electronic monitoring bracelet, submit to mental health counseling, and prohibited from opening new lines of credit over 1,000 US dollars.
- Binance officially acquires Indonesia’s crypto exchange, Tokocrypto. Pang Xue Kai, the former CEO of Tokocrypto, stated that the decision was made after careful consideration and that the best step for Tokocrypto moving forward is to utilize Binance’s capabilities to build a more advanced trading platform for crypto assets. Tokocrypto will continue to operate under its current name alongside Binance.
Cryptocurrencies Market Price Over the Past Week
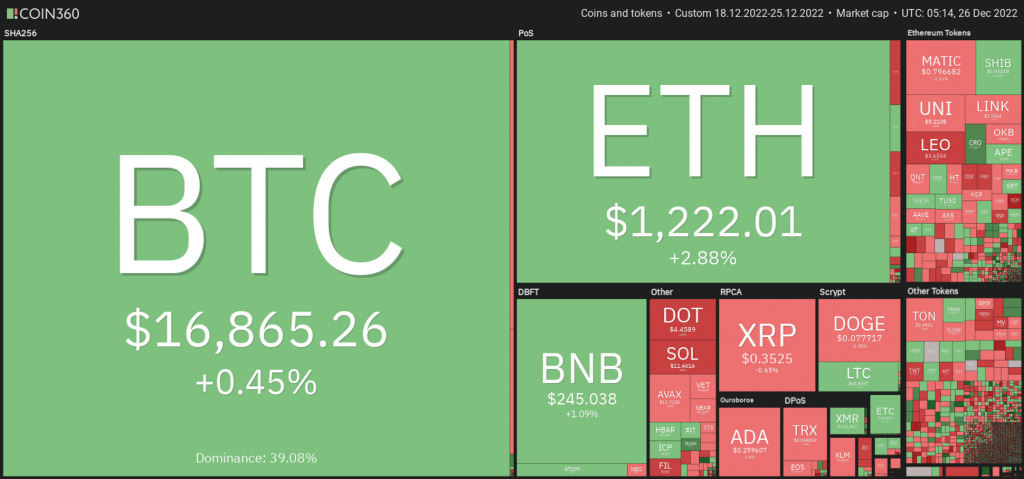
Top Gainers
- XDC Network +12.93%
- Helium +10.48%
- THORChain +7%
Top Losers
- Chain (XCN) -31.43%
- Trust Wallet Token (TWT) -20.86%
- Algorand -12.13%
References
- Elizabeth Napolitano and Jesse Hamilton, Sam Bankman-Fried Released on $250M Bail Secured by Parents, Coindesk, accessed 23 December 2022
- Anisa Giovanny, Breaking! Binance Resmi Akuisisi Tokocrypto, Coinvestasi, accessed 23 December 2022.
- Samuel Haig, Uniswap Allies With MoonPay to Bolster Debit Card Transfers, The Defiant, accessed 23 Desember 2022.
- Caleb Naysmith, Donald Trump’s NFT Collection Is Breaking Records, What Does This Mean for the Industry?, Yahoo Finance, accessed 24 Desember 2022
Share
Related Article
See Assets in This Article
UNI Price (24 Hours)
Market Capitalization
-
Global Volume (24 Hours)
-
Circulating Supply
-


