Reversal Pattern in Trading: Definition, Examples, and How to Read Them

Trading is an activity that can be practiced by various levels, ranging from beginners to experienced traders. Apart from understanding risk management, traders also need to recognize reversal patterns to identify potential trend reversals and make trading decisions. In this article, we will discuss the meaning of reversal patterns in trading, various examples, and how to read and use them effectively.
Article Summary
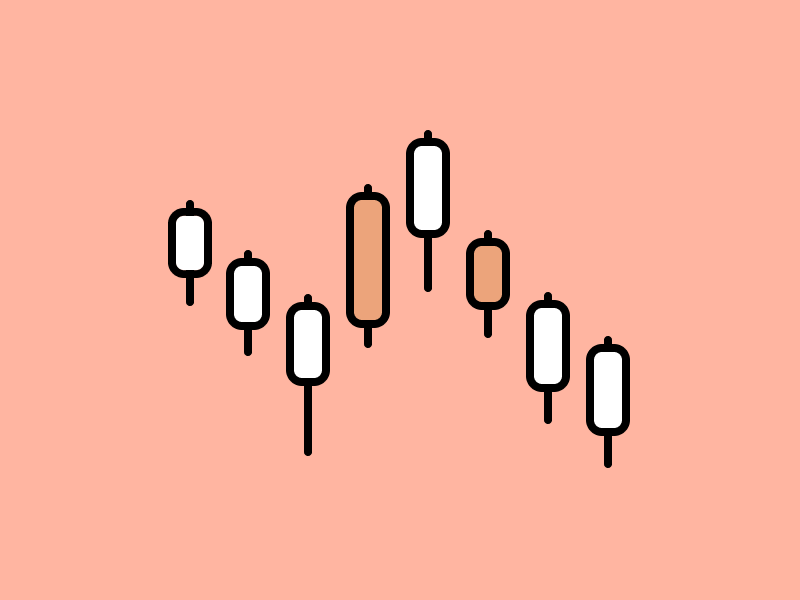
- 🔎 Reversal Pattern Definition: A price formation that forms on a chart and signals a potential reversal in the direction of a market trend. Unlike regular candlestick patterns, reversal patterns are generally multi-candle structures that take longer to confirm.
- ⛓️ Reversal Pattern Categories: Reversal patterns are divided into two categories namely Bearish Reversal Pattern and Bullish Reversal Pattern. Each has several patterns that can be visually recognized on the chart, such as Head & Shoulders, Double Top, and Rising Wedge for bearish signals, and Double Bottom and Falling Wedge for bullish signals.
- 💡 Trading Strategy with Reversal Patterns: Each reversal pattern has a specific reading and entry and exit strategy. The validity of a pattern is generally confirmed through a combination of candlestick structure, a breakout of the neckline or support/resistance level, and a surge in transaction volume that supports the direction of the trend reversal.
Definition of Reversal Pattern
Reversal patterns are price formations formed on a chart that signal a potential reversal in the direction of a market trend. Unlike candlestick patterns that only consist of one or two candles, reversal patterns are generally multi-candle structures that take longer to confirm, ranging from several days to several weeks depending on the timeframe used.
This pattern can be found not only on price charts, but also on technical indicator charts such as RSI and MACD, making it a flexible analysis tool for various instruments. The characteristic of reversal patterns lies in their consistency, where the same pattern shape often appears repeatedly across different assets and market conditions on different timeframes, making it a more measurable and objective analysis reference.
How Reversal Pattern Works
How reversal patterns work in reading changes in price direction is important for traders in making trading decisions. In general, reversal patterns can be formed from price movements visualized through candlesticks.
Candlestick itself has an important role in providing an overview of price movements periodically. In certain timeframes, a series of candlesticks can form various patterns, including reversal patterns, both from uptrend to downtrend and vice versa.
- Bearish Reversal Pattern: A price movement pattern that gives information that an upward trend has ended and a downward trend could potentially begin.
- Bullish Reversal Pattern: A price movement pattern that gives information that a downtrend has ended and an uptrend could potentially begin.
Reversal Pattern Example: Bullish Reversal Pattern
1. Double Bottom Pattern
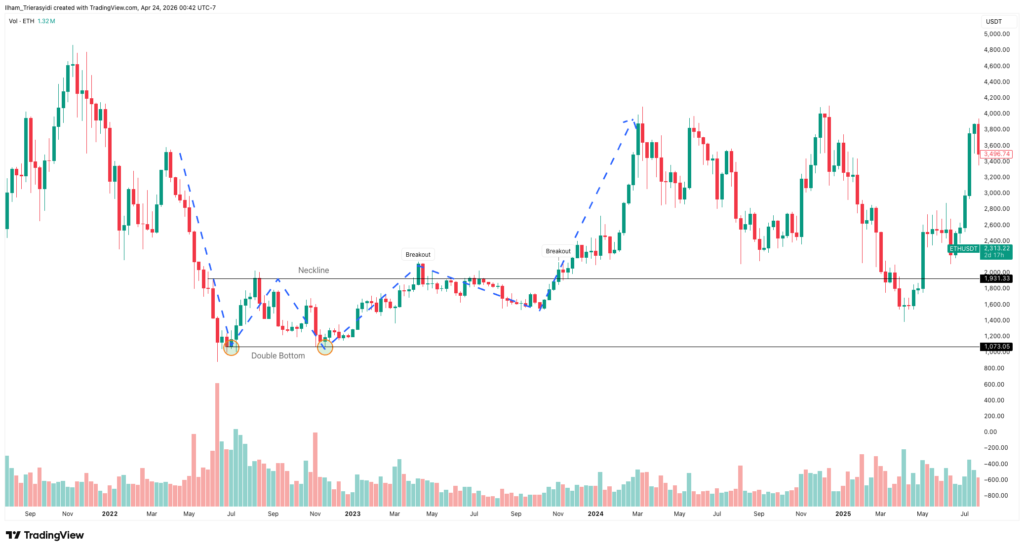
Double Bottom is a bullish reversal pattern that forms after the price has experienced a significant decline and found its lowest point as an early sign of a potential trend reversal.
This pattern is synonymous with the formation of two lows in relatively the same price area. After the second low is formed, the price then rises which signals the start of a trend reversal from a downtrend to an uptrend.
How to Read Bullish Reversal Pattern: Double Bottom
- If the market experiences a significant correction in a downtrend phase, pay attention to the area where the decline stops.
- If there is a first bounce of the price after a decline and the price goes back down to an area similar to the stopping point of the previous decline, the upper bounce area called the neckline is considered a resistance level.
- The neckline becomes the resistance area that needs to be broken after the second bottom area is successfully formed.
- If the price makes a second bounce, pay attention to the volume of buying transactions that occur, whether there is a significant spike.
- If the price manages to break the neckline and closes above it for several consecutive candles accompanied by a surge in the volume of buying transactions, then the pattern can be declared valid as a Double Bottom.
Entry and Exit Strategy Using Bullish Reversal Pattern: Double Bottom
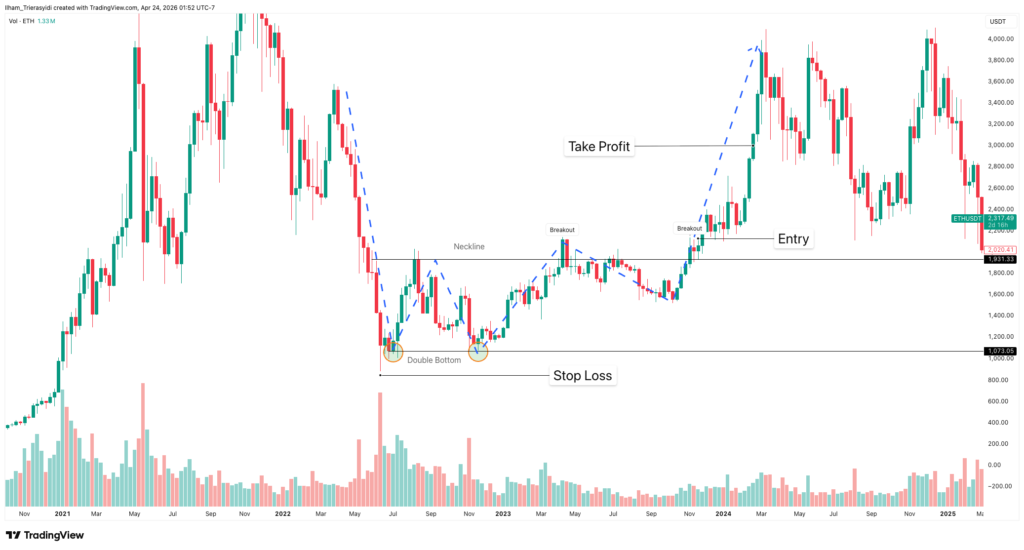
Sometimes, the best decision in the market is not to react, especially when the trend is still in a downtrend phase and no pattern has emerged that validates the formation of a Double Bottom. In this phase, the main focus is to observe whether an area has the potential to be the point where the first bottom forms.
After the first bottom is formed and the price bounces towards the neckline area, then back down near the previous bottom area, traders can determine entry by making the neckline area a key level that needs to be broken as confirmation before opening a position.
- Entry Strategy for Buy/Long
A valid entry confirmation is made after the price successfully breaks the neckline and closes above it for several consecutive candles, accompanied by a surge in the volume of buying transactions. The combination of these two conditions is a strong signal that a Double Bottom is validly formed.
- Take Profit Strategy
Take profit can be measured from the distance of the bottom area to the neckline and project the same distance upwards from the breakout point.
- Stop Loss Strategy
A commonly used stop loss placement is slightly below the bottom area. If the price drops back through this level, then the Double Bottom structure is no longer valid and the potential trend reversal needs to be re-evaluated.
2. Falling Wedge Pattern
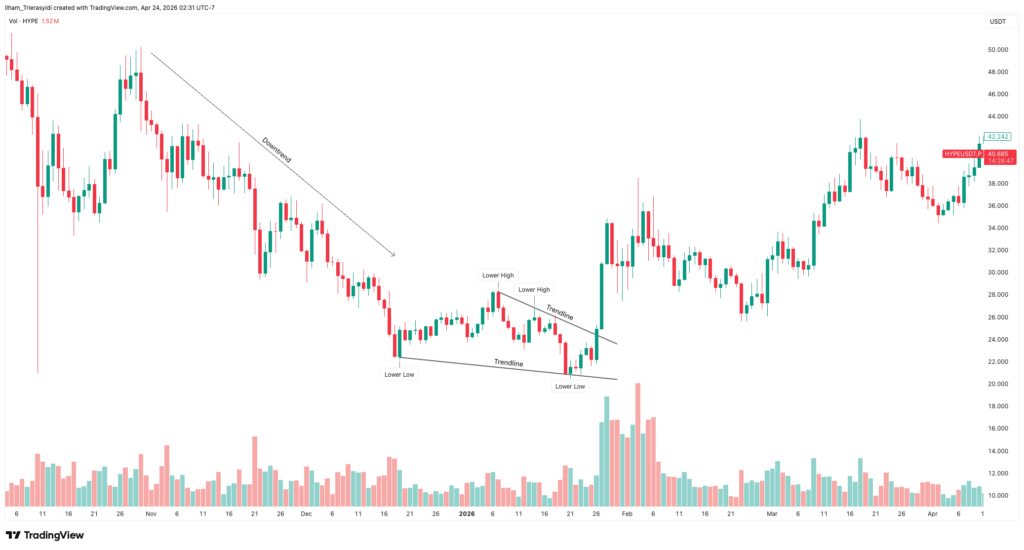
Wedge pattern as a trend reversal signal has become quite popular to identify potential changes in price direction. Unlike the Rising Wedge, the Falling Wedge is a pattern that can identify a potential reversal from a downtrend to an uptrend.
A Falling Wedge forms when the price forms a structure of lower highs and lower lows consecutively, but with a narrowing range. This narrowing occurs because the diagonal resistance line descends more steeply than the diagonal support line, until the two lines converge.
How to Read Bullish Reversal Pattern: Falling Wedge
- During a downtrend, pay attention to the structure of the price lows and price bounces that are formed, whether they move narrower over time.
- The Falling Wedge has a structure of lower lows and lower highs that form consecutively, but with a narrowing range as the diagonal resistance line descends more steeply than the diagonal support line.
- This pattern can be identified as long as the price is still moving within the wedge structure, by observing whether each price bounce fails to break the diagonal resistance but the decline is also increasingly limited.
- Confirmation of the reversal occurs when the candlestick manages to close above the diagonal resistance as a sign of a valid breakout, and ideally accompanied by a surge in buying volume to strengthen the signal.
Entry and Exit Strategy Using Bullish Reversal Pattern: Falling Wedge
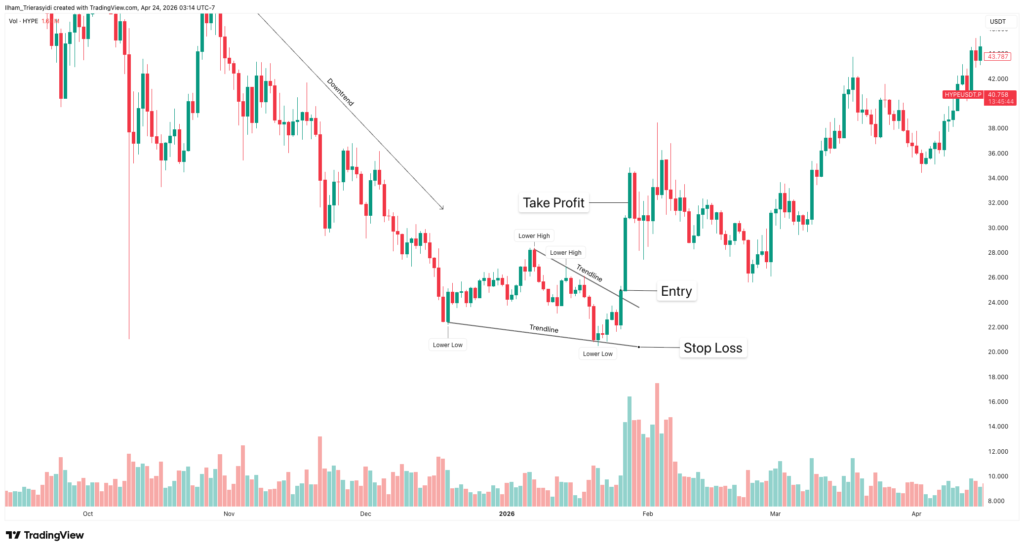
- Entry Strategy for Buy/Long
A valid entry is made once the candlestick successfully closes above the diagonal resistance accompanied by a confirmed surge in buying volume. The combination of the two is the strongest signal that the Falling Wedge has formed validly and has the potential for a continued reversal.
- Take Profit Strategy
Traders can measure the largest width of the wedge structure at the beginning of its formation and project that distance upwards from the breakout point.
- Stop Loss Strategy
Below the last lower low point formed before the breakout occurred can be used as a reference for placing a stop loss. The pattern can be said to be invalid if the price continues to decline and breakdown from the lower low point.
Example of a Reversal Pattern: Bearish Reversal Pattern
1. Head and Shoulders Pattern
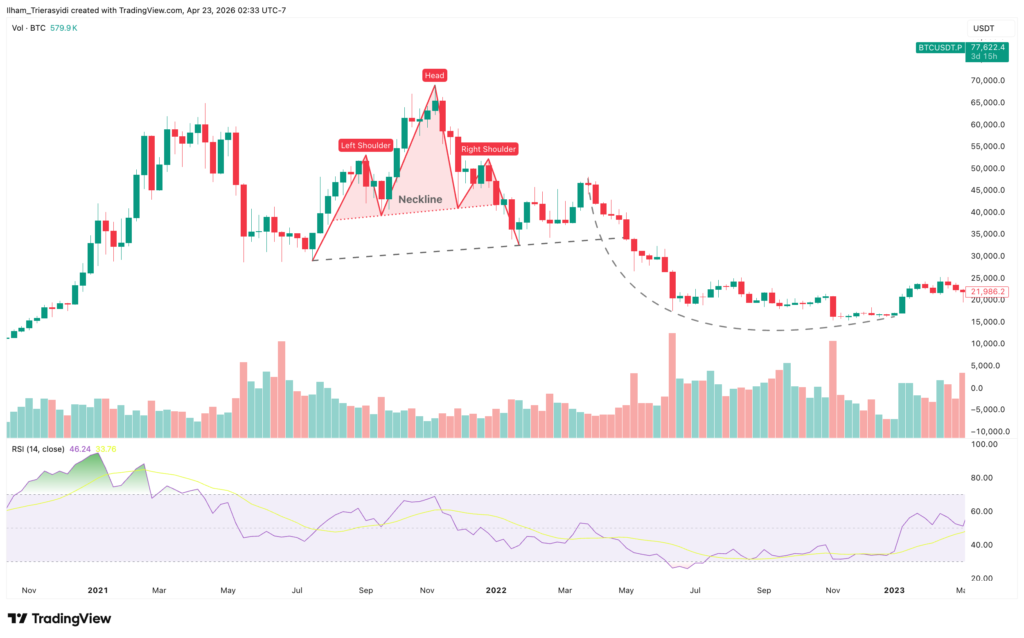
Head and Shoulders is a bearish reversal pattern that forms a “head”, “left shoulder”, and “right shoulder” structure. This pattern can be identified after a significant price increase in an asset.
Generally, when a chart forms a Head & Shoulders pattern, it can be a sign that a further decline is likely after the price fails to reclaim the previous high, whether the high is the “shoulder” or the “head”.
One way to identify a valid reversal pattern in a downtrend instance is to look at a combination of other indicators such as trading volume.
How to Read the Bearish Reversal Pattern: Head & Shoulders
- Head & Shoulders form after the market has experienced a strong rally. The price increase during the last rally forms a structure called the “left shoulder”, and at this point it looks like the price is forming a bear trap. After that, the price rises significantly again until it surpasses the high of the “left shoulder”, forming the “head” section.
- After the “head” is formed, the price corrects and bounces back, but the bounce does not make it beyond the “head” and only reaches a level equivalent to or around the “left shoulder”. This is where the “right shoulder” structure forms, confirming that the upward momentum has weakened and the Head & Shoulders pattern is beginning to be confirmed.
- In this structure, there is an area called the neckline that serves as the last horizontal support level to withstand downward pressure. If the price fails to defend this area and moves below it, then the potential for a trend reversal strengthens.
- If the candlestick structure provides confirmation, traders can strengthen their analysis by using additional indicators to validate that the downtrend is likely to continue. One common indicator is transaction volume.
- The volume of sales transactions grew during this downward trend reversal.
Entry and Exit Strategy Using Bearish Reversal Pattern: Head and Shoulders
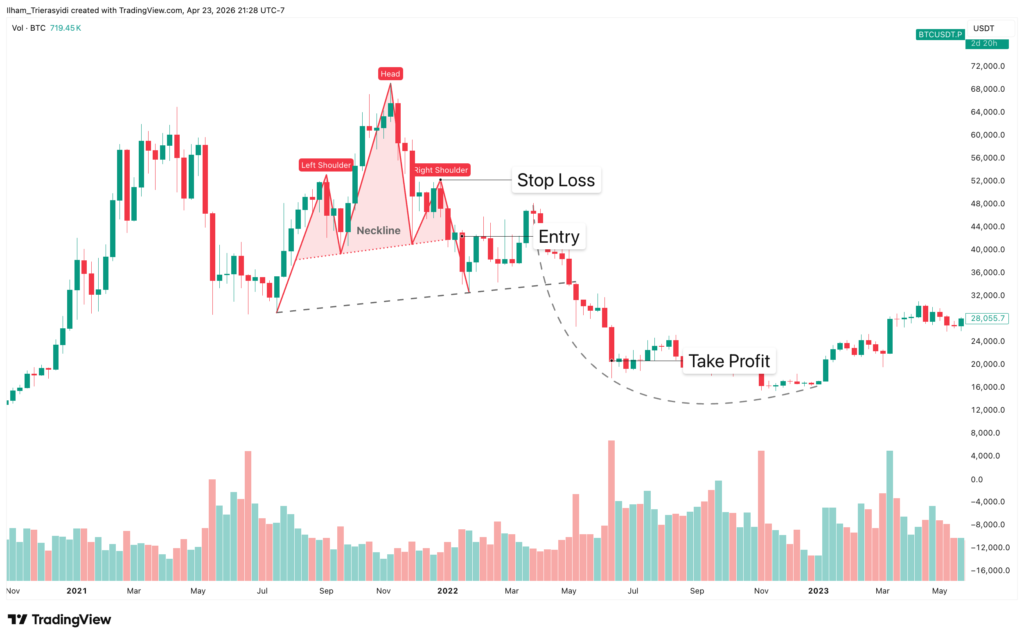
The Head and Shoulders pattern can be used as a reference for entry into a short position or exit position.
- Entry Strategy for Sell/Short
Once the “right shoulder” structure is formed and the upward momentum appears to be weakening as described in the previous point, traders can generally start preparing entry positions by waiting for confirmation of a breakout below the neckline area. A valid confirmation is usually signaled by a candle closing below the neckline, rather than simply touching the level, as this indicates that the selling pressure has been strong enough to convincingly break the last support level.
- Take Profit Strategy
To determine a price target or exit, a commonly used method is to measure the distance from the highest point of the “head” to the neckline area, then project the same distance down from the breakout point. This method can estimate measured and objective price movements so that traders have a clear reference in planning profit targets.
- Stop Loss Strategy
The stop loss placement commonly used in this pattern is slightly above the “right shoulder” level. The logic follows from the previous reading point, if the price goes back beyond that area, the Head & Shoulders pattern structure is no longer valid.
2. Double Top Pattern
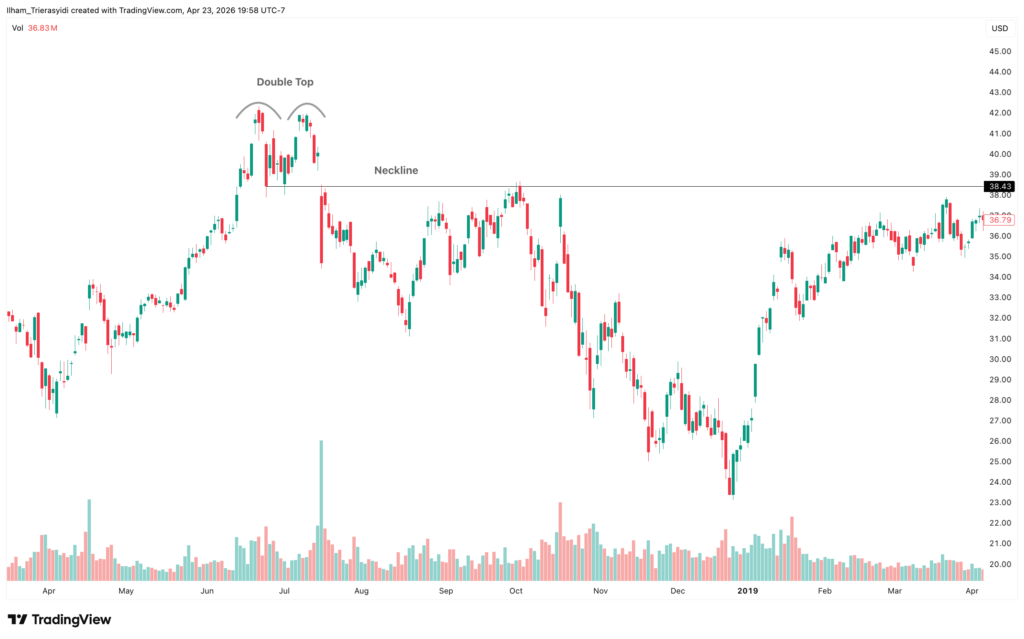
A Double Top is a bearish reversal pattern that is synonymous with two price peaks forming at relatively the same level and failing to break. This trend reversal pattern often signals the end of a rally that has been going on for a period of time.
The resistance area that forms a Double Top and the neckline are the two key levels in this pattern. Resistance serves as an upper limit that confirms that the price is unable to continue rising, while the neckline determines the start of a trend reversal that can be used as a reference by traders in planning market entry and exit positions.
How to Read Bearish Reversal Pattern: Double Top
- A Double Top generally forms after an asset has experienced a significant increase. This pattern is a sign that the price is no longer able to continue rising, which can be confirmed when selling pressure starts to dominate the price movement in the peak area.
- Pay attention to the price peaks that are formed. If there is a correction after the first price peak, traders can observe the next price movement before making a decision.
- If the price bounces off the neckline area and goes back up but is stuck around the first peak area and then goes back down, this is a signal that a second peak has formed. Wait for the downward direction to continue before taking a position.
- This trend reversal pattern can be validated by using the neckline area as a confirmation level. If the price moves down and closes the candle below the neckline, then the Double Top pattern can be considered valid.
Entry and Exit Strategy Using Bearish Reversal Pattern: Double Top
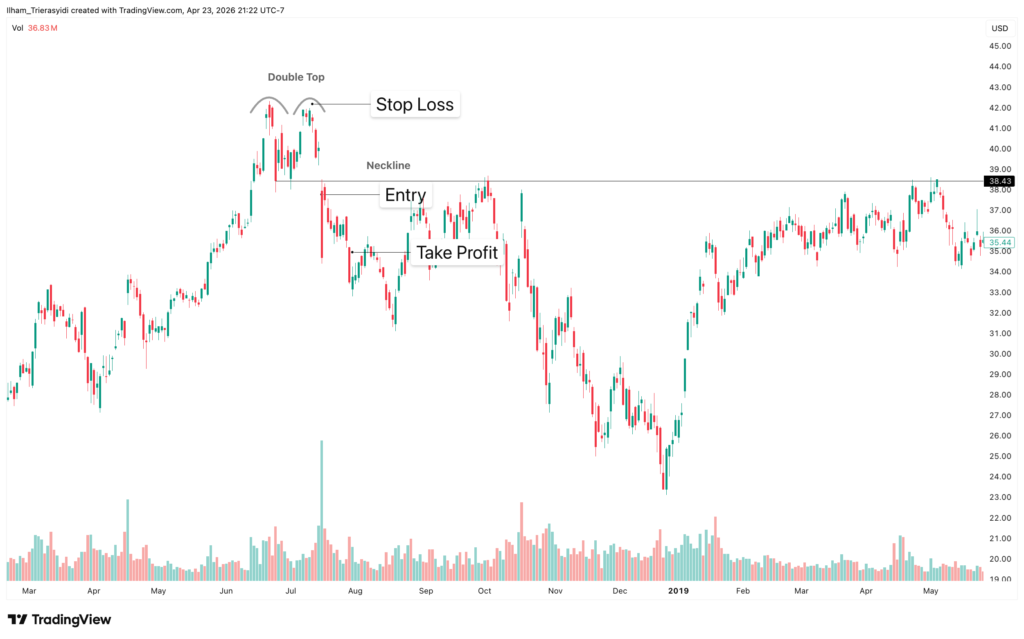
Once selling pressure is seen to start dominating in the peak area as described in the point on how to read, traders can start preparing entry positions by not rushing to make decisions before there is clear confirmation. A wait and see attitude in this phase is a more measured step than entering the market too early.
- Entry Strategy for Sell/Short
A valid entry confirmation can be made once the second peak is formed and the price moves down through the neckline area with a candle closing below that level. A candle closing below the neckline is a more convincing signal than simply touching the level, as it shows that the selling pressure is strong enough to shift the market balance.
- Take Profit Strategy
Traders can place profit targets downwards from the breakout point at the same distance from the peak area to the neckline. This approach provides an objective and measurable estimate of price movement as a reference for profit targets.
- Stop Loss Strategy
A commonly used stop loss placement in this pattern is slightly above the peak area. If the price goes back beyond that area, the Double Top structure is no longer valid and the potential trend reversal needs to be re-evaluated.
3. Rising Wedge Pattern
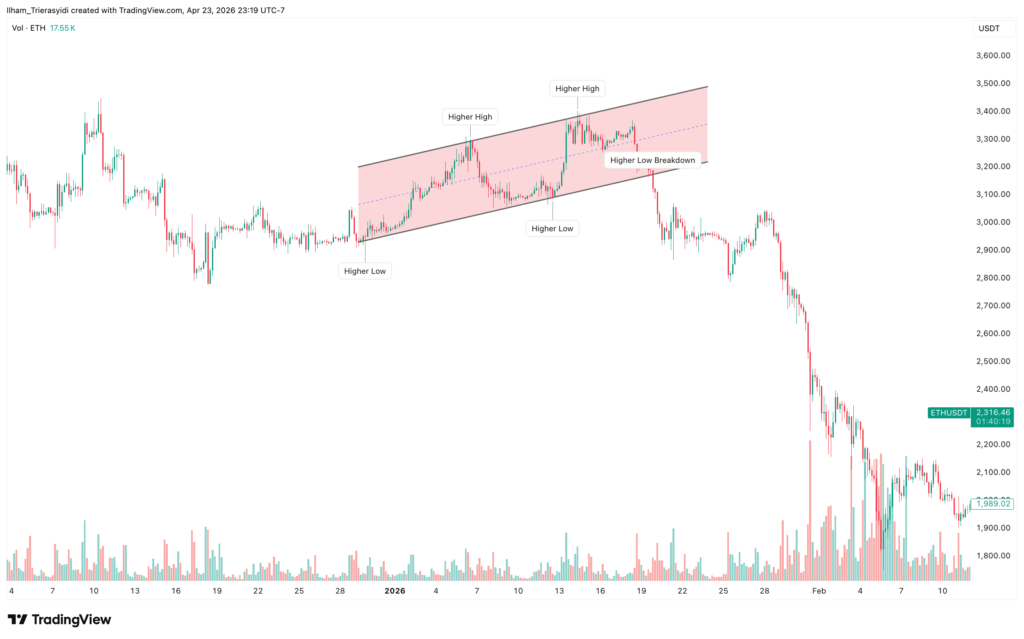
A Rising Wedge is a bearish reversal pattern that occurs after the price of an asset forms a higher high and a higher low with a narrowing range. It forms when the price has been consistently registering gains, but the momentum behind those gains begins to weaken.
The price movement that forms this pattern is identical to the gradual weakening of volume as the price continues to rise, which is an indication that the rise is no longer supported by strong enough asset purchases.
This pattern gives a technical signal that the price is unable to continue rising, which is then confirmed when there is a breakout from the diagonal support that connects the higher low lines in the wedge structure.
How to Read Bearish Reversal Pattern: Rising Wedge
- The Rising Wedge pattern is formed with a price structure that often results in a bull trap condition, where the price seems to signal an increase but eventually reverses down.
- The movement of this pattern is identical to the structure of higher highs and higher lows that occur within a certain period of time, but with an increasingly narrowing range until finally the price is unable to continue rising and surpass the previous higher high.
- After the upward momentum weakens, the price movement will start to decline and test the diagonal support that connects the higher low line in the wedge structure.
- Under these conditions, traders need to wait until the candle actually closes below the diagonal support as a valid breakdown confirmation, and ideally accompanied by an increase in selling volume to strengthen the signal.
Entry and Exit Strategy Using Bearish Reversal Pattern: Rising Wedge
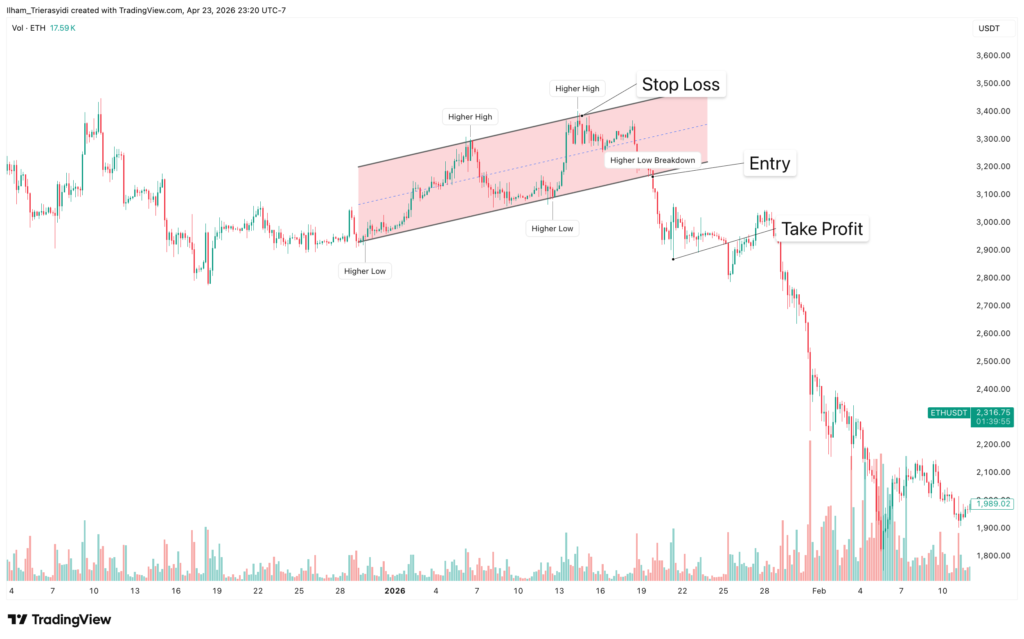
When a Rising Wedge structure is identified and the price is seen forming a bull trap condition in the upper line area of the wedge, traders should not rush to make a decision. This is precisely where vigilance needs to be increased because the visible bullish signal has the potential to become a trap before the price reverses.
- Entry Strategy for Sell/Short
Traders can start preparing for a short entry scenario by observing if the upside momentum really starts to weaken and the price fails to print a new significant higher high above the previous level. A valid entry confirmation can be made once the price tests the diagonal support and shows signs of stronger selling pressure in the area.
- Take Profit Strategy
Price targets or exits can be calculated by measuring the width of the wedge structure at the beginning of its formation and projecting that distance downwards from the breakdown point.
- Stop Loss Strategy
A commonly used stop loss placement is slightly above the last higher high formed before the breakdown occurred. The Rising Wedge structure is no longer valid if the price goes back beyond this level and successfully closes above it.
Conclusion
Reversal patterns are one of the technical analysis tools that can help traders identify potential changes in trend direction in a more measured and objective manner. By understanding the characteristics of each pattern, both Bearish Reversal Patterns such as Head & Shoulders, Double Top, and Rising Wedge, as well as Bullish Reversal Patterns such as Double Bottom and Falling Wedge, traders can create more measured entry and exit scenarios.
However, no single pattern can provide certainty. The power of reversal patterns lies in using them in combination with volume confirmation, technical indicators, and other factors, so that every trading decision remains based on broader analysis and disciplined risk management.
Frequently Asked Questions (FAQs)
What is a reversal pattern in futures trading?
Reversal patterns in futures trading are price formations on a chart that indicate that an ongoing trend could potentially end and reverse. Understanding why reversal patterns are important for futures traders is a foundation that cannot be ignored, as reversal signals can be directly utilized to open long or short positions in a more measured manner. The most common types of reversal patterns in futures include Double Top and Double Bottom, Head and Shoulders, Wedge patterns as trend reversal signals.
How do I recognize a valid reversal pattern?
How to identify a valid reversal pattern requires confirmation of several things simultaneously. First, the candlestick structure must form a complete pattern according to its characteristics. Second, the price must successfully break out of a key level such as a neckline or support/resistance and close outside that level for several consecutive candles. The role of volume in reversal pattern confirmation is also important.
Are reversal patterns suitable for short-term futures trading?
Reversal patterns can be used in short-term futures trading, but the best timeframe to read reversal patterns in futures needs to be tailored to each trading style because the smaller the timeframe chosen, the higher the potential for false signals, so volume confirmation and additional indicators and proper stop loss placement remain important factors to determine when reversal patterns are worth using in futures trading.
What indicators can be used to confirm reversal patterns?
The role of volume in reversal pattern confirmation is of utmost importance as it helps traders distinguish whether the price is preparing for a trend reversal or just a temporary correction.
What are the risks of using reversal patterns in futures trading?
A common mistake when reading reversal patterns in futures is entering position before the confirmation of the pattern is formed. Therefore, risk management when trading futures with reversal patterns through proper stop loss placement is a protective measure that cannot be ignored.
Trading Futures on Pintu Pro Web
Apart from accessing Pintu Futures through the app, you can also open long or short positions such as BTC, SOL, and more directly through Pintu Pro Web. On Pintu Pro Web, you can trade Futures and spot right away!
How to trade Crypto Futures on Pintu Pro Web:
- Go to https://pintu.co.id/
- Click the Open Pro on Desktop button at the top center.
- Register or log in to Pintu Pro Web.
- Go to the Futures section.
- Trade BTC and other cryptocurrencies.
Disclaimer: All information presented in this article has been prepared for general educational and informational purposes. This content is not intended as investment advice, recommendations, solicitation to buy or sell certain crypto assets, nor the basis for financial decision making. Any investment decision is entirely the responsibility of the reader, taking into account their financial condition, investment objectives, and risk tolerance.
References
- Cedric Thompson, “Identifying and Trading Rising Wedge Patterns for Market Reversals“, Investopedia, accessed on April 21, 2026.
- Tim Vipond, FMVA, “Head and Shoulders Pattern – Technical Analysis“, CFI, accessed on April 21, 2026.
- James Chen, “Double Top Pattern: Key Insights and Trading Strategies“, Investopedia, accessed on April 21, 2026.
- Arjun Remesh, “Falling Wedge Pattern: What is it? How it Works and How to Trade it?“, Strike, accessed on April 21, 2026.
Share