XRP Price Forecast: Buyers Could Spark a 13% Rally if They Break Through This Key Level
Jakarta, Pintu News – The price of XRP (XRP) jumped nearly 33% from its lows on December 31, and was up about 11% as of January 6, 2026. This rise marks one of XRP’s strongest short-term recoveries in recent months, having previously experienced a long consolidation phase.
This rally has had a positive impact on the overall XRP price outlook, although full confirmation is yet to come. Technical momentum suggests strengthening, but on-chain signals indicate that the market is starting to enter a sensitive profit-taking zone.
XRP’s ability to continue rising now depends on how the price moves when it faces an important resistance area.
Price Prediction Strengthens as Crossover Signal and Volume Meet, But…
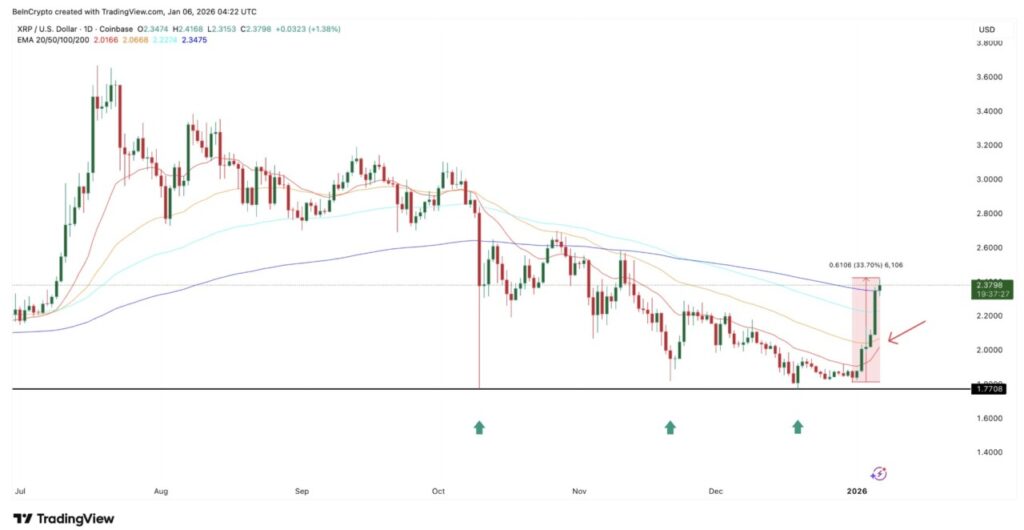
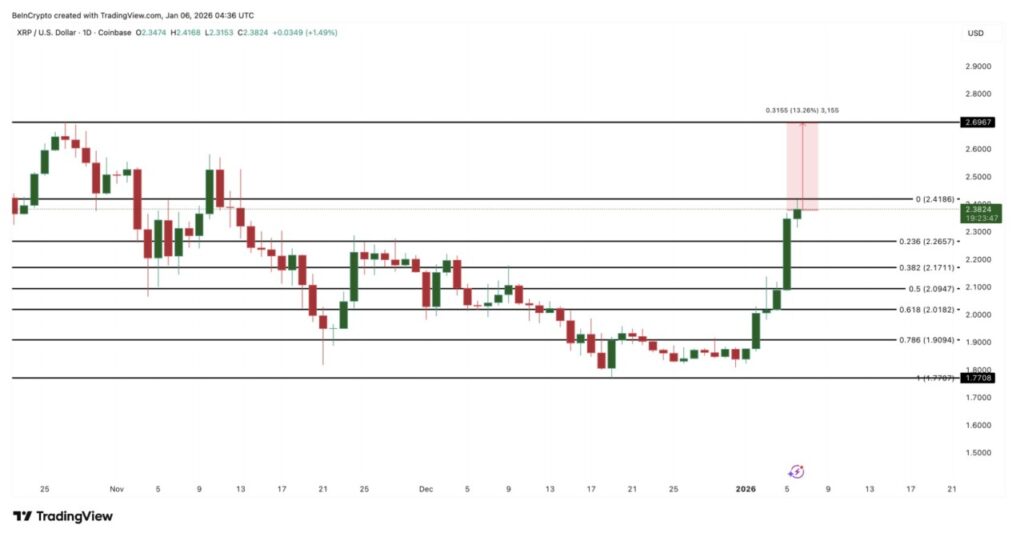
XRP’s price recovery started after forming a triple bottom pattern near the $1.77 level. This zone acted as a support area several times, and is now the structural basis of the ongoing rally.
Read also: Short Squeeze Triggers $400 Million Liquidation, Highest in Last 3 Months: What Happened?
Momentum indicators are starting to show support. The 20-day exponential moving average (EMA) is starting to approach the 50-day EMA. EMAs give greater weight to recent prices, so when the faster EMA (20-day) surpasses the slower EMA (50-day), it often signals a shift towards bullish momentum.
If this bullish crossover is confirmed, it historically supports a continuation of the uptrend, not just a temporary bounce.
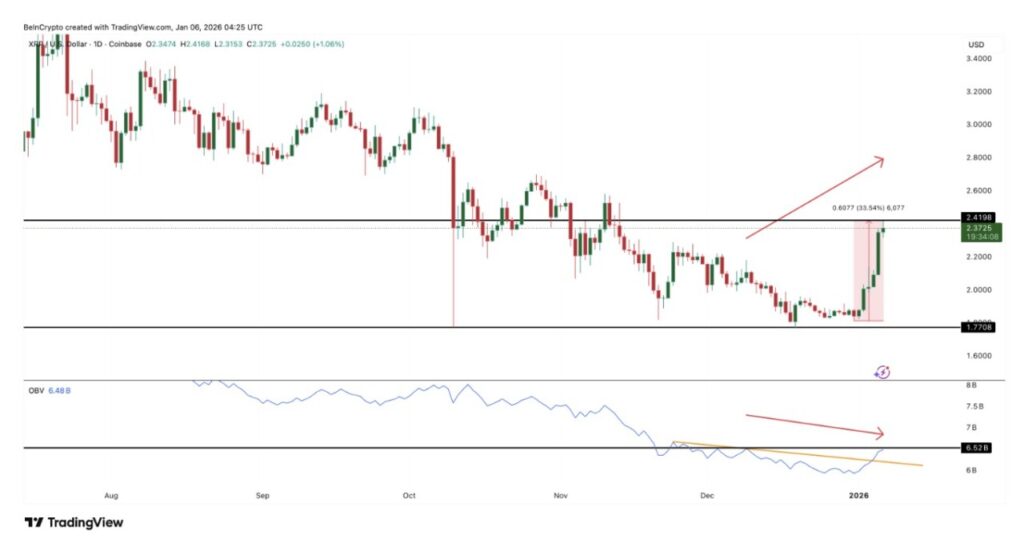
Volume behavior also supports this view, albeit with caution. The on-balance volume (OBV) indicator, which tracks whether volume is flowing in or out of an asset, has broken the downtrend line. This signals that buyers are starting to engage in a breakout.
However, the OBV has yet to form a clear new high despite the continued rise in XRP price – suggesting that buying pressure is increasing, but not yet too aggressively.
Also, the OBV upside started to slow down at the area around $2.41, as shown on the chart. The long wick on the candle also suggests that sellers may start to reappear at this level.
Overall, these signals strengthen XRP’s price outlook, but further confirmation of the price movement at higher levels is still needed.
On-Chain Data Shows Accumulation, but Profit Pressure Begins to Increase
On-chain data provides a more in-depth look at current market conditions.
Long-term holders are still continuing to accumulate. Long-term holders are wallets that have held XRP for a long time and have historically rarely sold.
Since December 30, the group has increased their net holdings from around 9 million XRP per day to around 47 million XRP. This represents a surge of over 420% in net accumulation during the rally phase, signaling continued conviction.
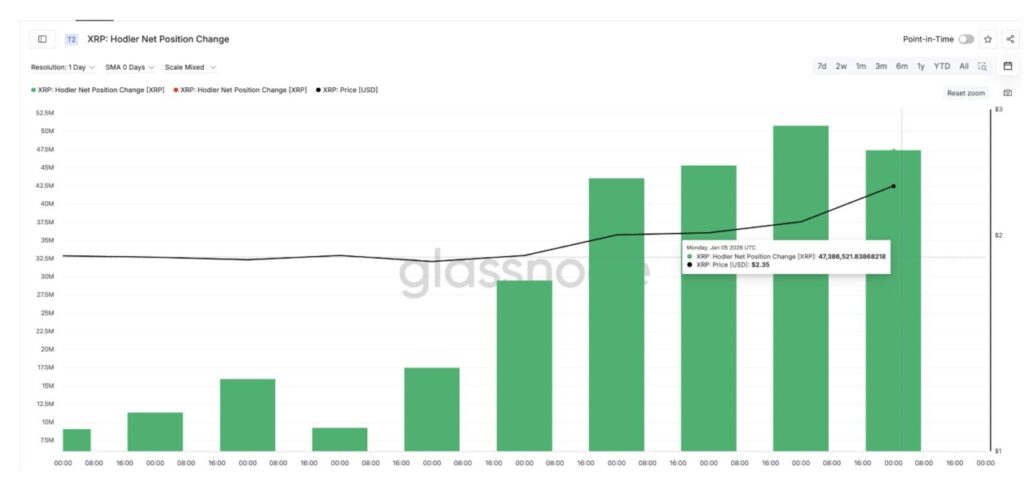
However, the pressure to take profits has also started to increase. The NUPL (Net Unrealized Profit or Loss) indicator for long-term holders – which measures how much unrealized profit they have – has returned to levels last seen in early December.
At that level of around 0.48-0.49, XRP had previously corrected around 14% in the nine days that followed. This does not mean that the same pattern is bound to repeat itself, but it does indicate that the market is re-entering a zone where profit-taking activity is likely to increase based on previous history.
Read also: Grayscale Shares Ethereum Staking Yield Amid Positive Crypto ETF Inflows
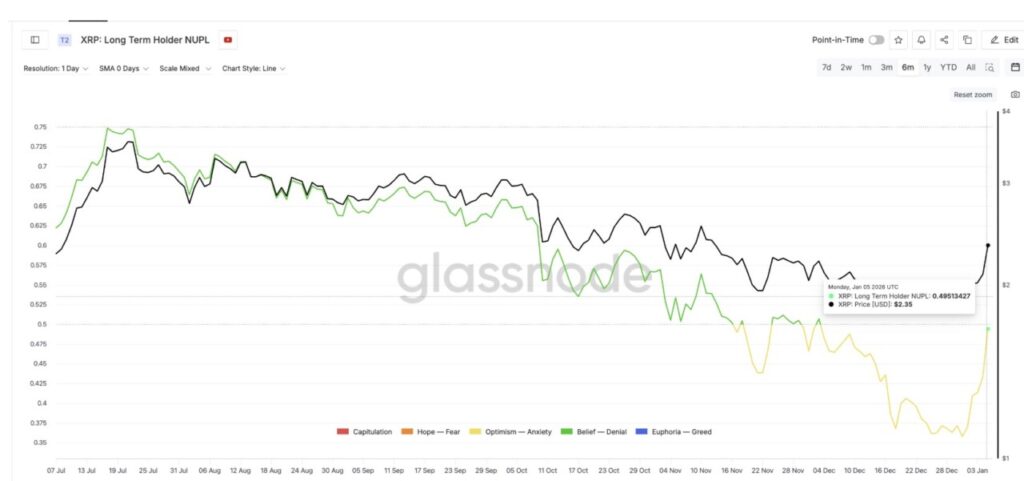
Importantly, the pace of accumulation by hodlers has slowed in the past two days, as evidenced by the decline in the previous metric. Long-term holders are still buying, but at a more selective pace since January 4, indicating that buyers are becoming cautious as prices and NUPL values rise.
XRP Price Prediction Now Hinges on Cost-Basis Wall at $2.41
All technical and on-chain signals are currently converging around the $2.41 zone.
The cost-basis distribution heatmap shows this area as the main supply cluster. The cost basis depicts where the coins were previously purchased. Between the $2.39 to $2.41 level, approximately 1.56 billion XRP was accumulated.
When the price returns to a zone like this, many holders tend to sell tobreak even, creating resistance pressure. The previous XRP price chart also highlights this resistance zone.
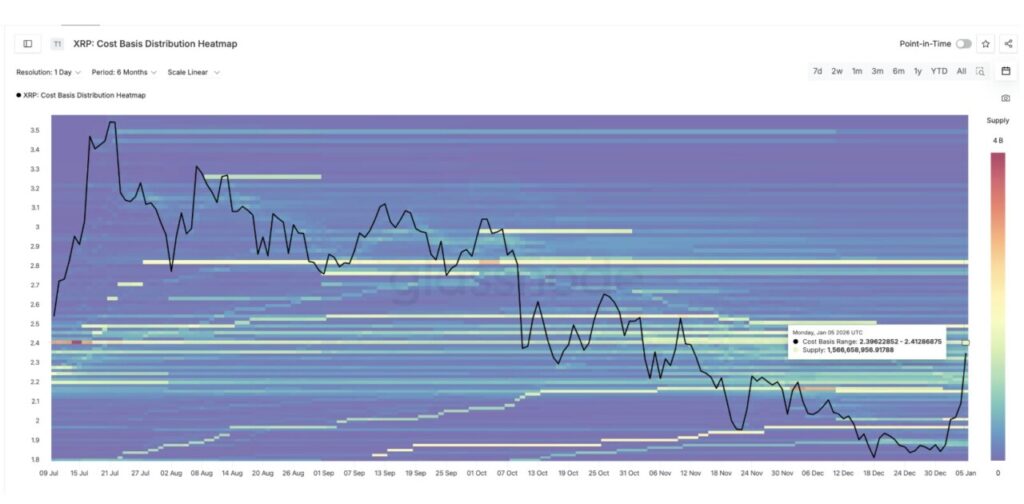
This is the reason why the XRP price is stuck around $2.41 and why the OBV indicator has started to flatten while the NUPL continues to rise.
For XRP’s bullish prediction to remain valid, the price needs to close the day with a net above $2.41. If that happens, the selling pressure from previous holders will weaken, and the next upside target will be around $2.69 – which means an additional upside potential of around 13% from current levels.
However, if XRP fails to break and hold above $2.41, downside risks increase. Initial support is around $2.26, with deeper support around $1.90. Even so, the overall rally structure is still considered intact as long as the price remains above $1.77.
The current XRP rally has momentum, but it is now entering its most important test. The next stage of the XRP price prediction depends not only on technical indicators, but on the ability of buyers to convincingly turn the $2.41 level from resistance to support.
That’s the latest information about crypto. Follow us on Google News to get the latest crypto news about crypto projects and blockchain technology. Also, learn crypto from scratch with complete discussion through Pintu Academy and stay up-to-date with the latest crypto market such as bitcoin price today, xrp coin price today, dogecoin and other crypto asset prices through Pintu Market.
Enjoy an easy and secure crypto trading experience by downloading Pintu crypto app via Google Play Store or App Store now. Also, get a web trading experience with various advanced trading tools such as pro charting, various types of order types, and portfolio tracker only at Pintu Pro.
*Disclaimer
This content aims to enrich readers’ information. Pintu collects this information from various relevant sources and is not influenced by outside parties. Note that an asset’s past performance does not determine its projected future performance. Crypto trading activities have high risk and volatility, always do your own research and use cold cash before investing. All activities of buying and selling bitcoin and other crypto asset investments are the responsibility of the reader.
Reference:
- BeInCrypto. XRP Price Prediction: Key Levels to Watch for Rally. Accessed on January 7, 2026