Is Chainlink Poised for a Breakout as Canton Integration Unlocks Access to an $8 Trillion RWA Market?
Jakarta, Pintu News – Chainlink price briefly traded at around $9,286, up 0.18% on February 26, as the token entered a consolidation phase after recording its latest gains.
The move comes after the announcement that Canton blockchain has enabled Chainlink’s data infrastructure directly across its ecosystem. The integration brings oracle services to a network that processes $350 billion worth of US Treasury bond repo transactions per day.
Canton-Chainlink Integration
Blockchain Canton announced the immediate implementation of Chainlink data infrastructure across its ecosystem to support institutional tokenization at scale. The integration brings Chainlink Data Streams, SmartData, and Proof of Reserve to a network that processes $350 billion in daily Treasury repo transactions.
Read also: Solana Reverses after Fakeout: Bears Trapped, Bullish Divergence Signal Emerges!
Since its launch in May 2024, Canton has grown as one of the premier platforms for regulated tokenized assets, with a foundation of over $8 trillion of on-chain RWA. Chainlink’s oracle services now provide real-time pricing and valuation, as well as collateral verification that institutions need for activities such as lending, settlement and risk management.
A number of Canton ecosystem partners – including CBTC by BitSafe, Thetanuts Finance, and Cairo – are reportedly already using Chainlink data standards in production environments. Chainlink Labs also serves as a Canton Super Validator, contributing to the governance and transaction sequencing process.
Technical Analysis: Price Bounce from $7.20 and EMA Resistance
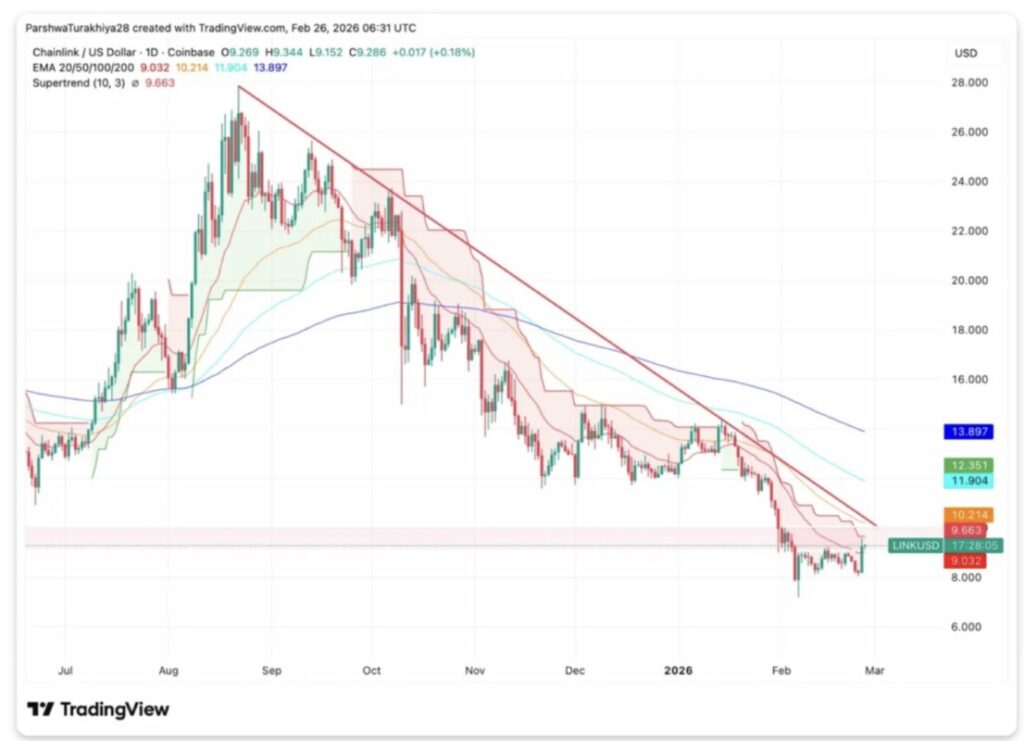
On the daily chart (Feb 26), Chainlink is still moving below all major moving averages despite bouncing off the latest low. The indicator positions mentioned are: 20-day EMA at $9,032, 50-day EMA at $10,214, 100-day EMA at $11,904, and 200-day EMA at $13,897.
Meanwhile, the Supertrend indicator still shows a bearish bias at $9,663, indicating selling pressure remains dominant despite the catalyst of the Canton news.
Technical points that stand out:
- Price tests 20-day EMA resistance area at $9,032
- All major EMAs stacked as overhead resistance
- Bearish supertrend at $9,663
- A relatively firm bounce off the February low of $7.20
In terms of movement structure, the decline from the area above $27 in August to around $7.20 in February represents a correction of around 73%. The rise to $9,286 means a recovery of about 29% from that low, but the overall pattern is still likely to be corrective due to the layered resistance of the EMA.
A daily close above $9,663 could potentially reverse the Supertrend and signal the beginning of a more meaningful momentum shift. Until that happens, the emerging rally is likely to be viewed as a relief rally within a larger correction phase.
The integration of Canton could be a fundamental catalyst, but confirmation of a trend reversal remains dependent on the price reclaiming key technical levels.
Read also: Bitcoin Price Returns to $67,000 Today: BTC ETF Inflows Reach $506 Million!
Price Consolidation and Overbought Signal on the 2-Hour Chart
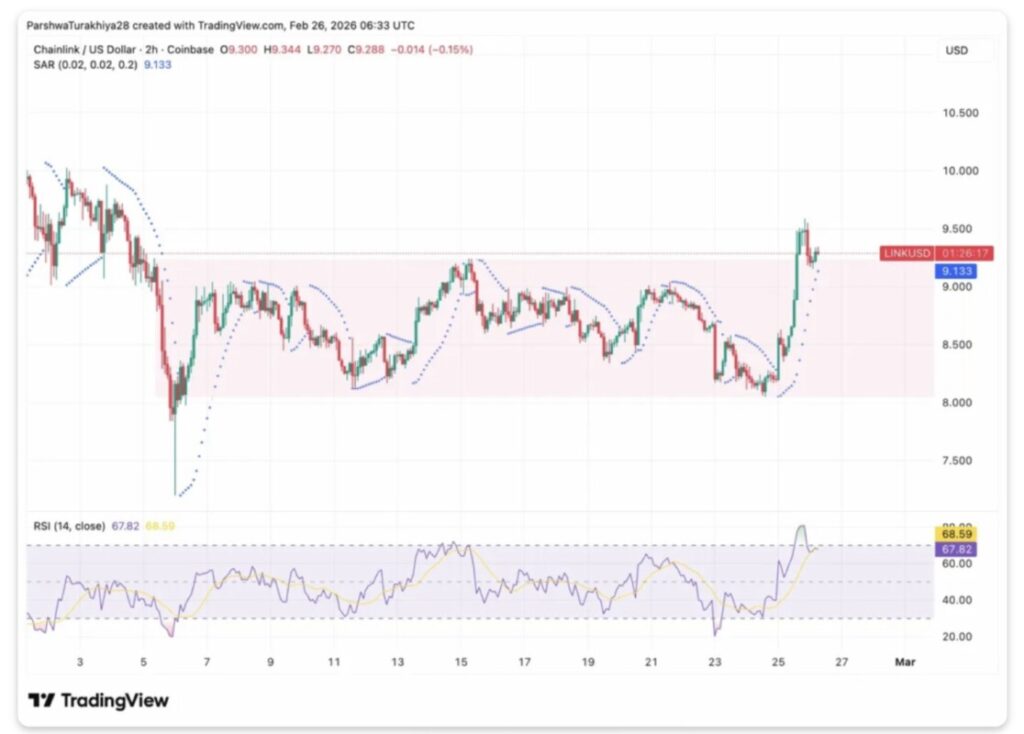
The 2-hour chart (2/26) shows Chainlink consolidating around $9.30 after spiking to $9.50 following the announcement regarding Canton. The Parabolic SAR indicator is at $9.133 and serves as an immediate support. Meanwhile, the RSI reached 67.82, close to the overbought area, but started to decline as the price entered the consolidation phase.
Visible movement structure:
- Price consolidates below $9.30 resistance area
- SAR support is at $9,133
- RSI at 67.82 and close to overbought
Buyers pushed LINK up quickly from $7.20 to $9.50 in a sharp recovery, but sellers were seen defending the $9.30-$9.50 resistance zone. News on Canton catalyzed the bounce, but price action indicated that some market participants were inclined to take profits near resistance, rather than add to long positions.
If the price is able to move up sustainably above $9.50, then the Supertrend level of $9,663 is back within reach. Conversely, if the price drops through $9,133, the Parabolic SAR could potentially turn bearish and open up a downside opportunity to retest the $9.00 psychological area.
Follow us on Google News to stay up to date with the latest in crypto and blockchain technology. Check Bitcoin price, usdt to idr and tokenized nvidia stock price through Pintu Market.
Enjoy an easy and secure crypto trading and crypto gold investment experience by downloading the Pintu crypto app via Play Store or App Store now. Also, experience web trading with advanced trading tools such as pro charting, various order types, and portfolio tracker only at Pintu Pro.
*Disclaimer
This content aims to enrich readers’ information. Pintu collects this information from various relevant sources and is not influenced by outside parties. Note that an asset’s past performance does not determine its projected future performance. Crypto trading activities are subject to high risk and volatility, always do your own research and use cold hard cash before investing. All activities of buying and selling Bitcoin and other crypto asset investments are the responsibility of the reader.
Reference:
- Coin Edition. Chainlink Price Prediction: Bulls Charge as Canton Integration Unlocks $8T RWA Market. Accessed on February 27, 2026