Ethereum Climbs Back to $2,000 as Analysts Warn of a Potential Breakout or Fresh Liquidation Risk
Jakarta, Pintu News – Ethereum (ETH) is currently near a price area that could determine its next major move. Two widely shared chart analyses are now pointing to the same risk: if key support fails to hold, downward pressure could increase rapidly.
Ethereum Price Up 1.49% in 24 Hours
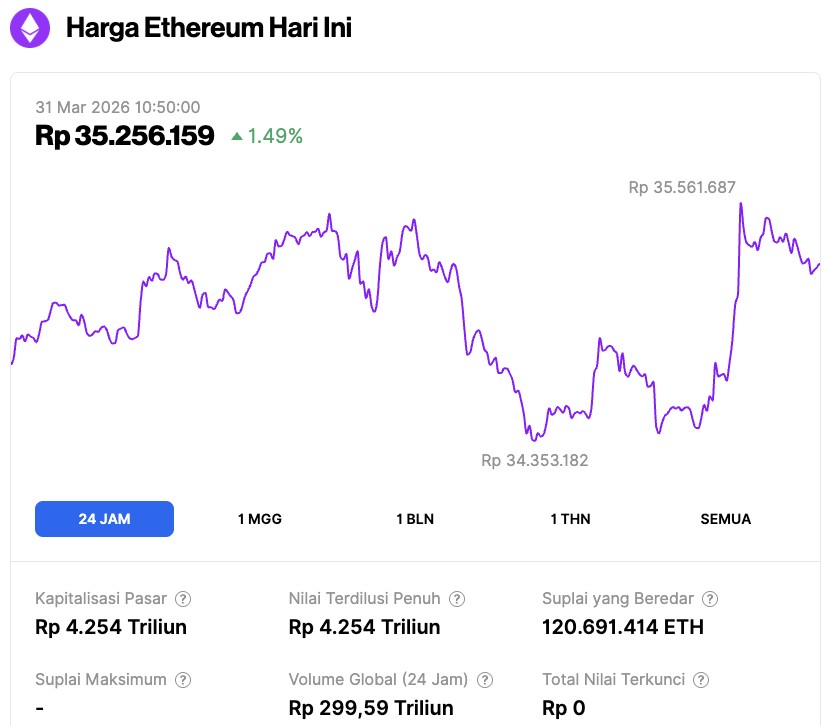
As of March 31, 2026, Ethereum was trading at around $2,066, or approximately IDR 35,256,159, after gaining 1.49% over the past 24 hours. During that period, ETH fell as low as IDR 34,353,182 and climbed to a high of IDR 35,561,687.
At the time of writing, Ethereum’s market capitalization stood at approximately IDR 4,254 trillion, while its daily trading volume jumped 52% to IDR 299.59 trillion over the last 24 hours.
Read also: Bitcoin Reaches $67,000 Today: Can BTC Build Momentum in April 2026?
Ethereum Hangs Around $2,000 as Analysts Highlight Risk of Breakout or Liquidation
Ethereum is trading around the $2,000 level in a chart shared by X user Ted Pillows, who calls the area important support to determine ETH’s next move.
The Binance ETH/USDT daily chart shows the price hovering around $2,003.80 at the time of the post, with Ethereum moving in a narrow range after experiencing a sharp decline from levels above $2,600 at the start of the year.
Based on the chart, the $2,000 area is now just below the nearest resistance zone in the range of $2,100 to $2,150. Ted Pillows thinks Ethereum needs to hold in the current area to open up opportunities for a rally towards the resistance zone. The chart also depicts a bullish scenario, marked by a white colored path, where the price first reclaims the nearby levels and then continues to rise towards around $2,400 to $2,624 if the momentum continues to strengthen.
On the other hand, the same chart also shows a downside scenario if Ethereum fails to maintain support around $2,000. In that case, the price is projected to drop towards the $1,820 area, with further supports around $1,740, $1,693, and $1,550. Ted Pillows mentioned that failure to hold at current levels could trigger a chain liquidation, which is when forced selling pressure increases after leveraged positions are swept out of the market.
Structurally, the chart still shows weakness even though the price has stabilized recently. Ethereum has previously broken some old support areas, which are now likely to turn into resistance. Therefore, the $2,000 level is the closest line that market participants are watching: holding above this area could open up room for a short-term recovery, while a break below could potentially deepen the correction already underway.
Read also: Solana Price Prediction: SOL value under pressure, $70 zone now key area
Ethereum Chart Indicates Continuation of Bearish Trend
The four-hour timeframe Ethereum chart shared by Crypto Patel shows a bearish continuation scenario.
According to the analyst, the latest price movement reflects weakness after ETH was rejected from the supply area on the higher timeframes. The chart highlights a daily fair value gap around $2,078, which is an area where Ethereum appears to be losing momentum after testing resistance above it.
Crypto Patel thinks the structure displays several bearish signals simultaneously. They include SMT divergence at the peak area, liquidity that has been swept away, and a series of lower highs that indicate that control is starting to return to sellers. On the chart, these signs appear before the projected decline towards the sell-side liquidity area below the latest support.
The analysis places the downside targets at $1,980, then $1,800, and eventually $1,500. Meanwhile, the bearish scenario is considered nullified in case of a four-hour candle close above $2,204. According to the chart, that level would weaken the bearish outlook as it signals that Ethereum managed to reclaim the area that now serves as an important resistance.
Overall, the market structure shows that Ethereum failed to maintain strength after entering the supply zone. Instead of continuing to rise, ETH reversed down from the fair value gap and formed a pattern that analysts interpreted as a signal of bearish continuation.
As such, the market focus has now shifted from upward expansion opportunities to the potential for prices to drop to pockets of lower liquidity, where forced selling pressure or stop hunting could accelerate weakness.
Follow us on Google News to stay up to date with the latest in crypto and blockchain technology. Check Bitcoin price, usdt to idr and tokenized nvidia stock price through Pintu Market.
As a safe crypto app, Pintu provides a crypto trading experience to access crypto gold investment easily and conveniently. You can also see today’ s gold jewelry price and today’s gold bullion price to support your investment activities and portfolio diversification as well as learn crypto through Pintu Academy.
Download the Pintu crypto app via Play Store or App Store now. Enjoy web trading experience with advanced trading tools such as pro charting, various types of order types, and portfolio tracker only at Pintu Pro.
*Disclaimer
This content aims to enrich readers’ information. Pintu collects this information from various relevant sources and is not influenced by outside parties. Note that an asset’s past performance does not determine its projected future performance. Crypto trading activities are subject to high risk and volatility, always do your own research and use cold hard cash before investing. All activities of buying and selling Bitcoin and other crypto asset investments are the responsibility of the reader.
Reference:
- Coinpaper. Ethereum Price Prediction: Analysts Warn of Sharp Move Ahead. Accessed on March 31, 2026