Ethereum Price Hovering at $2,000 Today: Analysts Say ETH Faces Huge Liquidation Pressure

Jakarta, Pintu News – Ethereum is currently showing two cautionary signals simultaneously. On the one hand, the momentum on the daily chart is starting to weaken. On the other hand, there is a large liquidation cluster slightly above the current price, around $2,100.
The combination of these two conditions indicates that ETH is in a fairly narrow area, with the potential for sharper price movements if pressure increases in either direction. So, how is Ethereum’s current price movement?
Ethereum Price Up 1.62% in 24 Hours
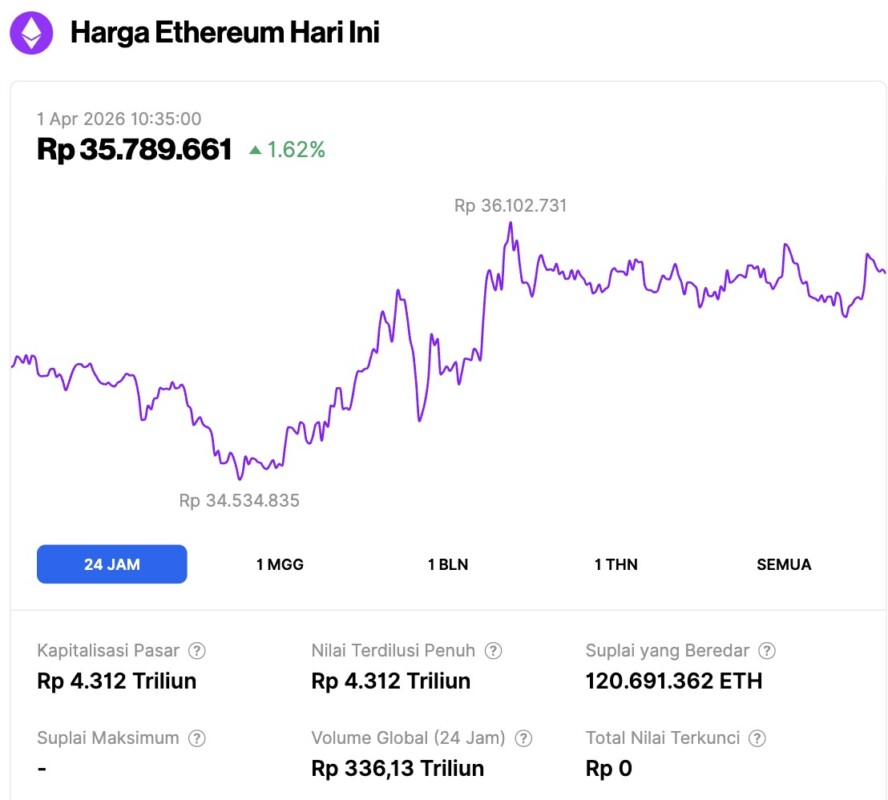
As of April 1, 2026, Ethereum was trading at around $2,097, or approximately IDR 35,789,661, after gaining 1.62% over the past 24 hours. During that time, ETH moved between a low of IDR 34,534,835 and a high of IDR 36,102,731.
At the time of writing, Ethereum’s market capitalization stood at roughly IDR 4,312 trillion, while its 24-hour trading volume climbed 13% to IDR 336.13 trillion.
Read also: Bitcoin Holds Steady at $67,000 Today: What Could Happen Next?
ETH RSI Break Signals Momentum Starting to Weaken
This daily chart of ETH shows a pattern that resembles a rising wedge after the sharp decline in February. The price briefly formed a slight higher low, while the upside remained stuck at the same relative resistance area around $2,200. This means that buyers did manage to push ETH up from its lowest point, but it has not been able to break through the resistance limit.
The more important part of the chart is the RSI line below it. Previously, the RSI was moving in an uptrend since early February and supported the slow recovery of prices. But now, that uptrend appears to have been broken. This usually indicates that the momentum is fading even before the prices actually experience a deeper drop.
So, the main point Ted is trying to make is that weakness in the RSI can appear first, and then the price movement follows afterwards.
Currently, ETH is still inside the pattern. As such, it hasn’t confirmed a full breakdown yet. Even so, the structure looks quite fragile. If ETH drops through the lower uptrend line in the $2,000 to $2,030 area, then the wedge pattern could potentially fail and the price could go back to testing lower support areas, possibly around $1,900, and then the February lows in the $1,750 to $1,800 range.
Conversely, if ETH is able to rally back and close above the horizontal resistance near $2,200, then this bearish scenario becomes less relevant. In that case, the pattern currently forming could turn into a stronger recovery attempt, rather than a signal towards a breakdown.
Read also: These 6 US Economic Data Potentially Shake Crypto Ahead of Good Friday
Overall, the chart is temporarily bearish as the momentum has already weakened, while the price is still in the phase of testing the support area.
ETH Faces Huge Liquidation Pressure in the $2,100 Area
CoinAnk’s liquidation heatmap shows that the largest ETH liquidation cluster is around the $2,100 level. The brightest area on the chart is concentrated in that zone, indicating a large accumulation of leveraged positions that could potentially be liquidated if the price moves into that area.
This is important because liquidation zones often act like price magnets. In other words, the market tends to move towards these levels when liquidity gathers there. In this context, the chart indicates that $2,100 is the main area traders are watching, as it contains the greatest concentration of potential liquidation.
At the same time, the chart also shows that there is a pile of liquidity above this area, specifically in the range of $2,100 to $2,200. Therefore, if ETH manages to rise through $2,100, volatility could potentially increase rapidly. A move into that zone could trigger forced position closures and create a sharper price reaction.
On the downside, there is also clear liquidity support in the $1,900 to $1,950 area. This means that ETH is currently trading between two important pockets of liquidity. However, the clearest message from this chart is that the $2,100 level stands out as a major liquidation area as well as the pressure point that has the most potential to push price movements to the upside.
Follow us on Google News to stay up to date with the latest in crypto and blockchain technology. Check Bitcoin price, usdt to idr and tokenized nvidia stock price through Pintu Market.
As a safe crypto app, Pintu provides a crypto trading experience to access crypto gold investment easily and conveniently. You can also see today’ s gold jewelry price and today’s gold bullion price to support your investment activities and portfolio diversification as well as learn crypto through Pintu Academy.
Download the Pintu crypto app via Play Store or App Store now. Enjoy the web trading experience with various advanced trading tools such as pro charting, various types of order types, and portfolio tracker only at Pintu Pro.
*Disclaimer
This content aims to enrich readers’ information. Pintu collects this information from various relevant sources and is not influenced by outside parties. Note that an asset’s past performance does not determine its projected future performance. Crypto trading activities are subject to high risk and volatility, always do your own research and use cold hard cash before investing. All activities of buying and selling Bitcoin and other crypto asset investments are the responsibility of the reader.
Reference:
- Coinpaper. Ethereum Price Prediction: ETH Enters High-Risk Zone. Accessed on April 1, 2026