XRP April 2026 Price Prediction: What to Expect?
Jakarta, Pintu News – XRP entered April 2026 under pressure, trapped inside the descending channel pattern that has shaped its direction since mid-July 2025. March closed with losses of around -1.94%, extending the string of negative months to six consecutive months since 2025.
The appearance of a death cross on the 3-day chart, weakening medium-term holder conviction, as well as an increase in risky leveraged positions all indicate that the pressure on prices continues.
However, April has historically been one of the relatively strong months for XRP. As such, the direction the token moves in April will largely be determined by whether seasonal forces are able to offset the deterioration of the established technical structure.
Historical History Gives Hope, but XRP’s 3-Day Chart Sends a Warning
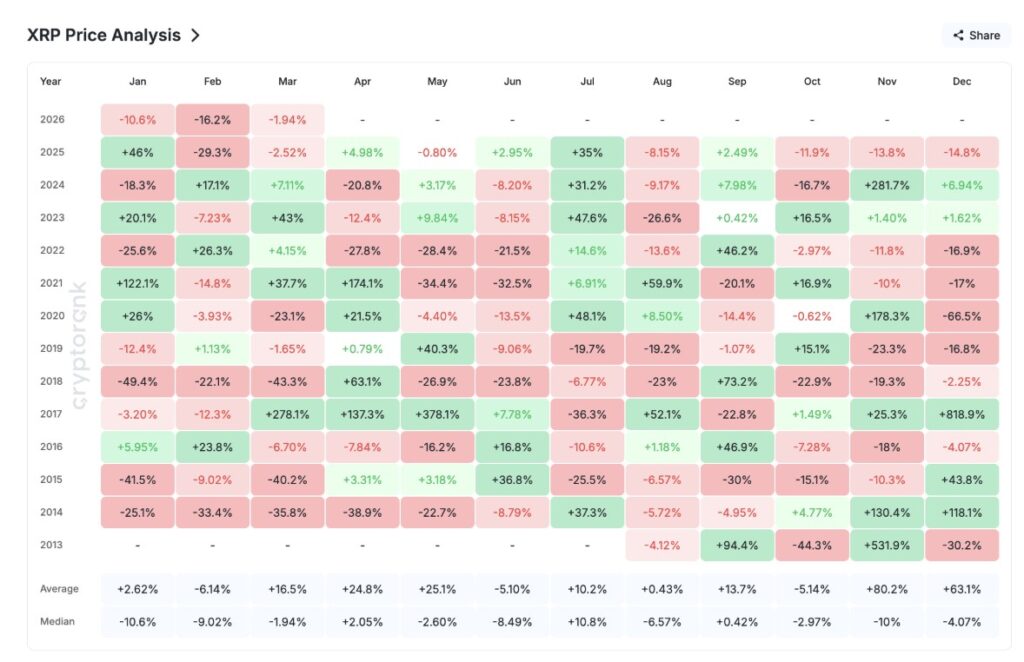
The monthly yield chart shows that the price of XRP throughout 2026 is still under pressure. Historically, January, February, and March do tend to record negative median returns, so the weakness in these three months is still relatively in line with past patterns.
Read also: As 40% of Altcoins Approach Their Lowest Levels, These 22 Tokens Still Show Strength!
However, April has historically presented a different picture. The average return of XRP in April was recorded at +24.8%, with a positive median of +2.05%. However, as throughout 2026 the seasonal patterns on large cryptocurrencies such as BTC and ETH have missed their historical trends several times, relying on past data alone remains risky.
The 3-day chart explains why caution is warranted. Since mid-July 2025, XRP has been moving down in a descending channel pattern, and this weakening trend has recently resulted in a death cross, which is when the 50-day Exponential Moving Average (EMA), a trend indicator that puts more emphasis on recent price movements, drops through the 200-day EMA.
EMA crossovers on this timeframe have often been followed by deep corrections in the past. In October, the crossover when the 20 EMA fell through the 50 EMA triggered a drop of about 32%.
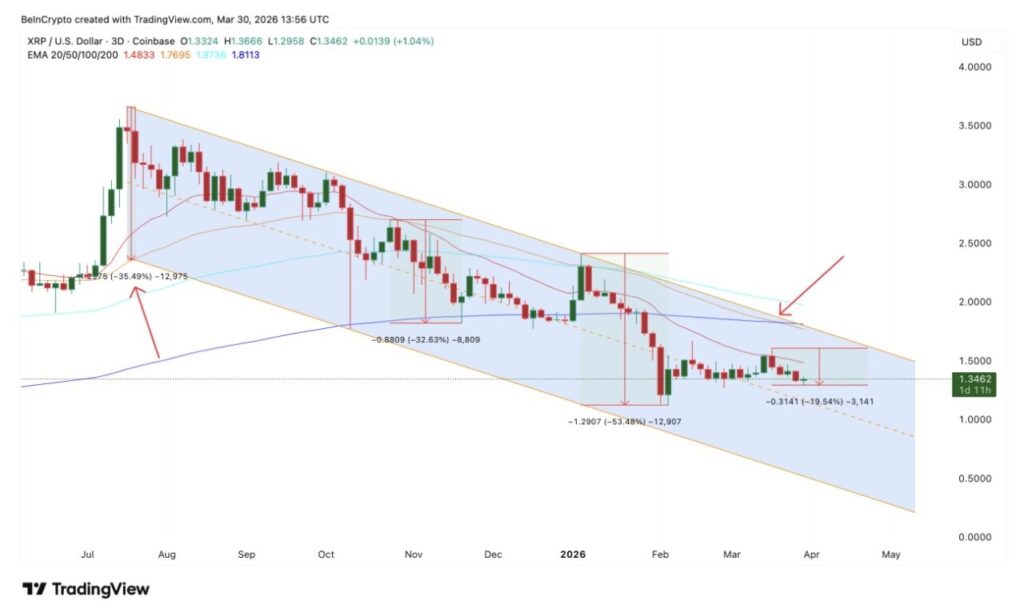
Then in January, another crossover prompted a correction of up to 54%. Meanwhile, the current death cross has so far resulted in a weakening of around 19%.
If this pattern continues towards the lower trend line of the descending channel, then the conservative downside target is around 35%. If the widest part of the channel is taken into account, the correction could even widen to 54%.
In the period from November 24 to March 23 on the 3-day chart, XRP formed a lower high in price, while the Relative Strength Index (RSI), a momentum indicator, only returned to the same level.
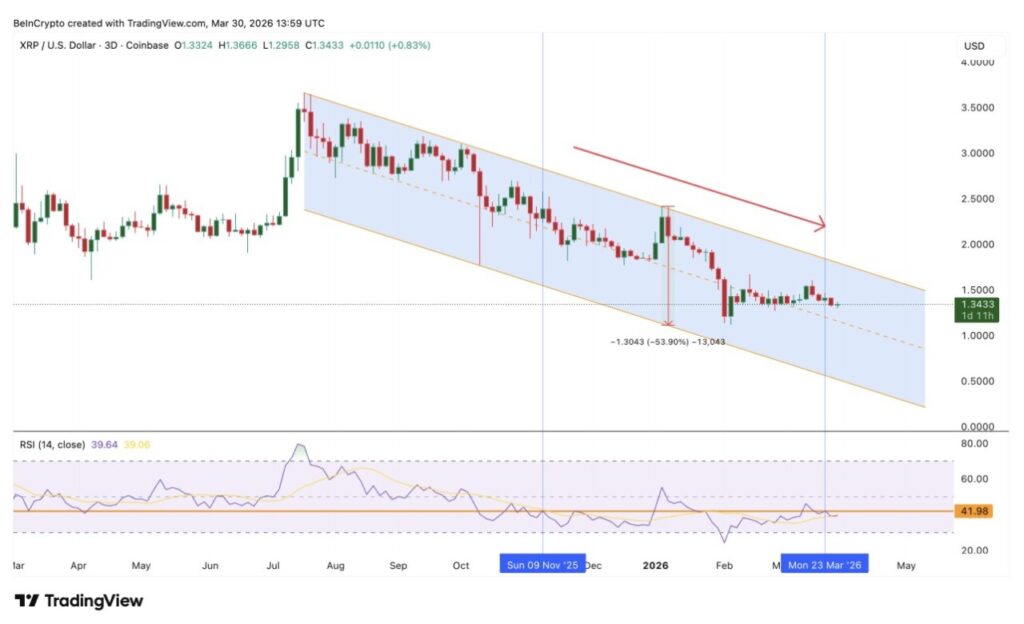
When the RSI fails to rise with the broader price structure and a hidden bearish divergence appears, it indicates that the pullback that started on March 17 still has the potential to continue. This also reinforces the notion that the correction triggered by the EMA structure may not be complete.
Holder’s Confidence Starts to Weaken
However, technical signals alone are not enough to confirm a deeper correction. On-chain data is needed as an additional layer of confirmation.
The HODL Waves metric, which tracks the percentage of supply by ownership age group, shows that medium-term holder confidence started to weaken ahead of April.
The 6-month to 12-month holder group, which is one of the most solid XRP holder bases, had increased its share since late February. Their holdings rose from 22.768% to 23.54% on March 27.
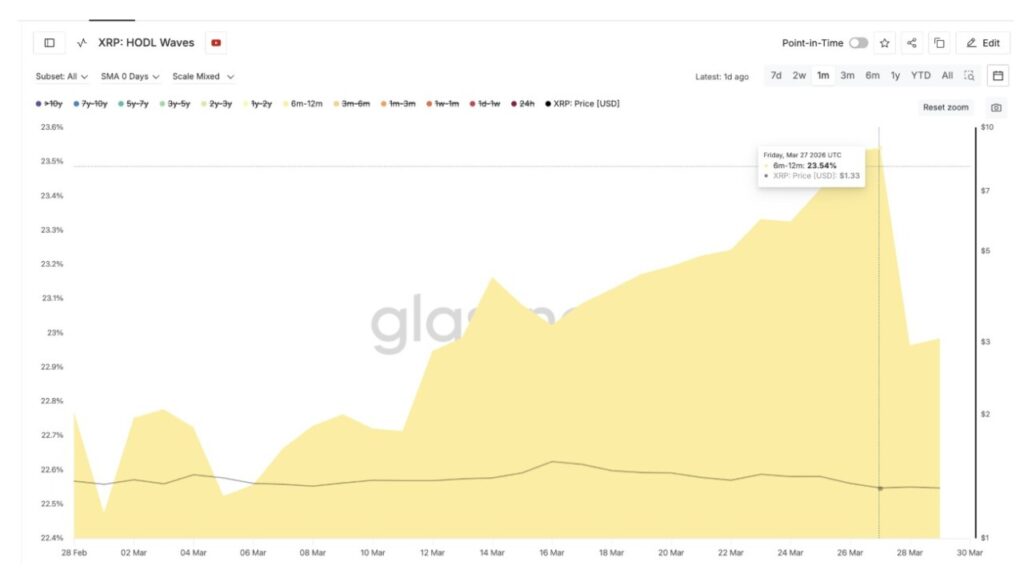
But after March 27, the group began to reduce its position. Their share of holdings fell from 23.54% to around 22.98%. The timing of this decline came after the RSI signal that appeared on March 23, indicating that the bearish pressure seen on the chart was now starting to be reflected in the behavior of holders.
If high conviction holders continue to reduce their exposure throughout April, then one of the structural support layers for the XRP price will weaken. The cost basis data also shows quite clearly where that support area is.
The cost basis heatmap shows a dense supply cluster of around 19.6 million XRP concentrated in the $1.27 to $1.28 range. This area is the strongest nearby demand zone.
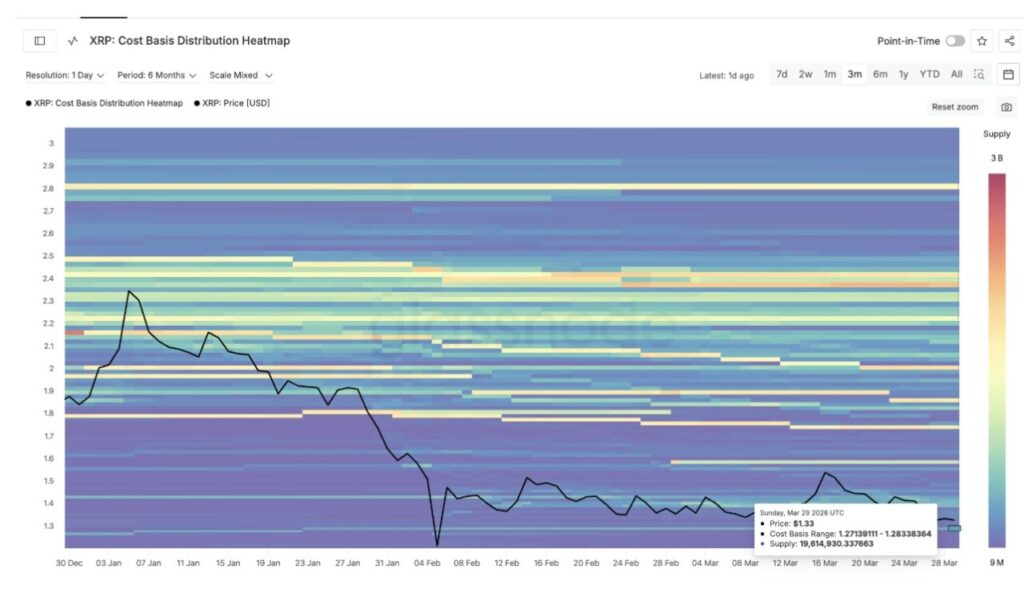
If XRP drops through this cluster, the loss of this support base could accelerate selling pressure, especially when holders with high conviction have started to retreat from the market.
New Long Positions Add Risk when Open Interest Changes Direction
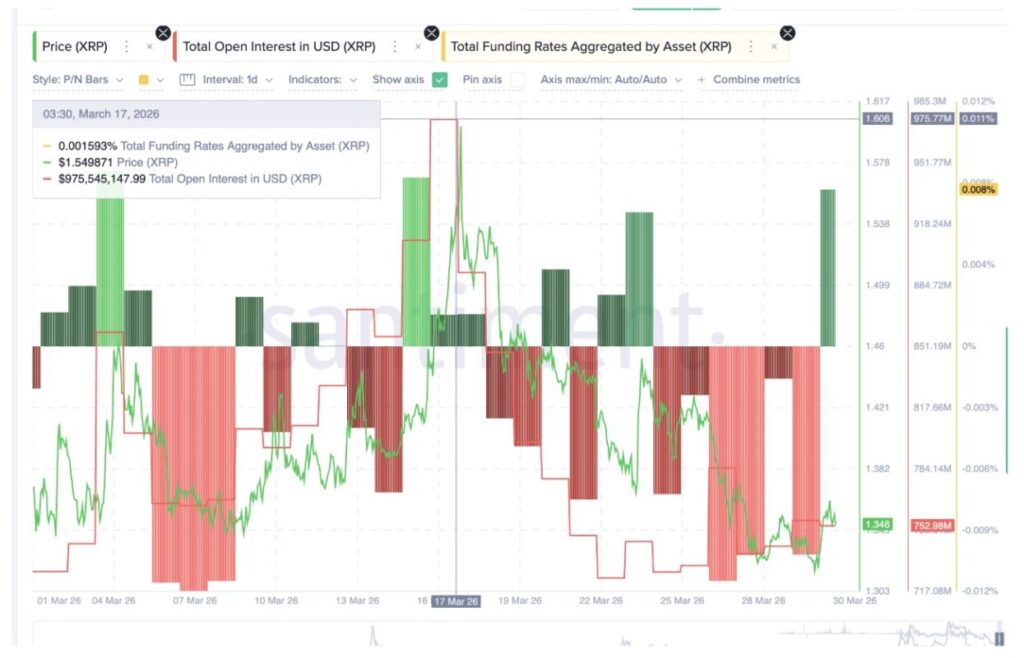
The leverage picture adds one more concern ahead of April. Open interest fell from $975.77 million on March 17 to a low of $723.96 million on March 23, a correction of about 26%. After that, it rose again to $752.98 million.
This increase indicates that new positions are starting to enter the market, rather than just old positions being retained.
Read also: Will Pi Network Price Strengthen Ahead of April 6 Node Upgrade Deadline?
The funding rate, an indicator that reflects the balance between long and short positions on perpetual contracts, also moved up from 0.0015% on March 17 to 0.008% currently. When the funding rate increases and open interest recovers from its low point, it generally signals that new long positions are being opened.
The situation created a fragile market structure. Short positions did get liquidated during the price drop on March 17 to 23, but the XRP price was unable to respond with a meaningful bounce.
Now, long positions have been re-entered amid higher funding rates, while the chart structure, high conviction holder behavior, and RSI signals are all still leaning bearish. If the price of XRP drops through the $1.27 cluster, then these leveraged long positions face the risk of liquidation, which could eventually magnify the downward pressure.
XRP Price Levels to Watch in April
The most crucial level for XRP in April is $1.29. This area coincides with the 0.786 Fibonacci level and is slightly above the dense supply cluster in the $1.27 to $1.28 range.
If XRP closes below $1.29 on the 3-day chart, then the cluster will immediately come under pressure. If that area is broken, the next support is at $1.20, which is in line with the Fibonacci 1.0 level. After that, on the longer timeframe, the $0.96 area is the next level to watch.
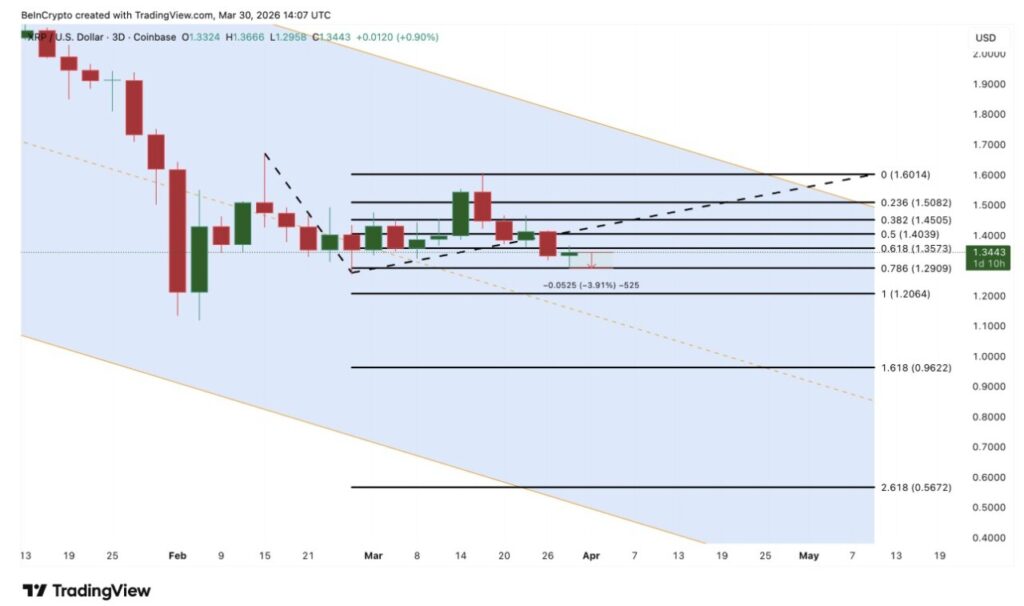
On the upside, XRP needs to reclaim the $1.45 level first to show early signs of recovery, followed by the $1.50 area. If the price is able to break $1.60, it would be a clean breakout signal from the downtrend line and potentially change XRP’s April outlook from defensive to more constructive.
For now, XRP’s main focus in April is to defend the $1.29 area. Death crosses, weakening holder conviction, the presence of a dense supply cluster just below the current price, as well as a risky buildup of leverage all suggest that the direction of least resistance is still to the downside.
As such, the price’s ability to stay consistently above $1.45 will be the difference between a recovery rally towards $1.60 or a continuation of weakness towards $1.20 or even lower.
Follow us on Google News to stay up to date with the latest in crypto and blockchain technology. Check Bitcoin price, usdt to idr and tokenized nvidia stock price through Pintu Market.
As a safe crypto app, Pintu provides a crypto trading experience to access crypto gold investment easily and conveniently. You can also see today’ s gold jewelry price and today’s gold bullion price to support your investment activities and portfolio diversification as well as learn crypto through Pintu Academy.
Download the Pintu crypto app via Play Store or App Store now. Enjoy the web trading experience with various advanced trading tools such as pro charting, various types of order types, and portfolio tracker only at Pintu Pro.
*Disclaimer
This content aims to enrich readers’ information. Pintu collects this information from various relevant sources and is not influenced by outside parties. Note that an asset’s past performance does not determine its projected future performance. Crypto trading activities are subject to high risk and volatility, always do your own research and use cold hard cash before investing. All activities of buying and selling Bitcoin and other crypto asset investments are the responsibility of the reader.
Reference:
- BeInCrypto. XRP Price Outlook For April 2026. Accessed on April 3, 2026