Ethereum Rebounds to $2,100 Today as Trendline Signals a Broader Uptrend Structure
Jakarta, Pintu News – Ethereum (ETH) is currently showing two very different signals simultaneously. In the short term, the price is still stuck in an important battle area between support and resistance, while on the larger chart, the broader bullish structure is still intact and has been able to survive several previous corrections.
Then, how is the current ETH price movement?
Ethereum Price Up 3.80% in 24 Hours
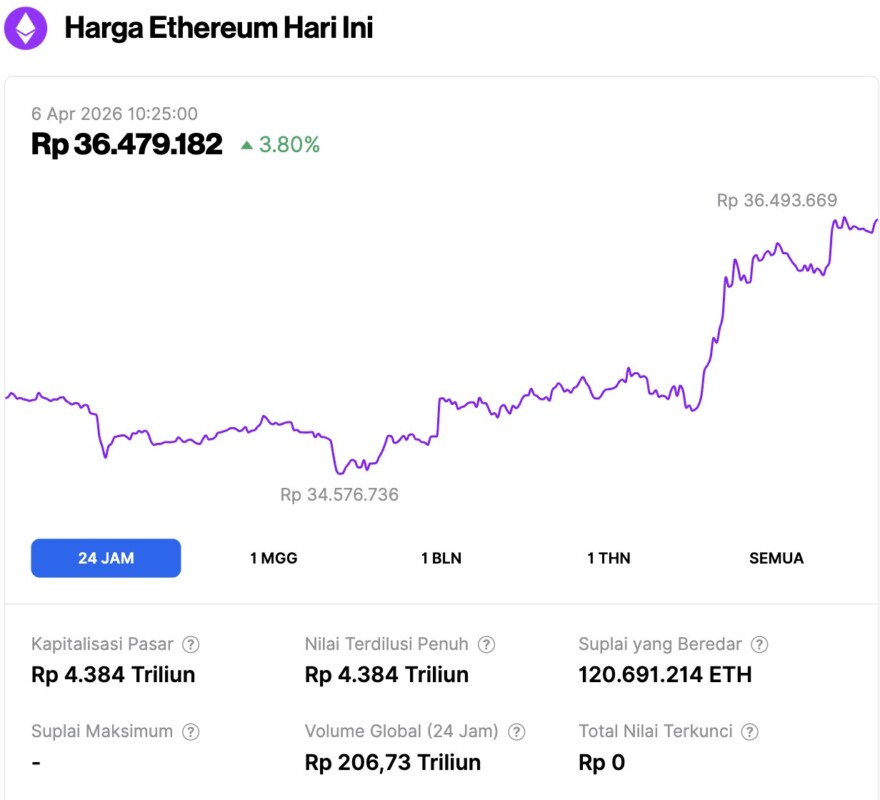
On April 6, 2026, the price of Ethereum was recorded at around $2,134 or the equivalent of IDR 36,479,182, an increase of 3.80% in the last 24 hours. During this period, ETH touched its lowest level at IDR 34,576,736 and its highest level at IDR 36,493,669.
As of writing, Ethereum’s market capitalization now stands at around IDR4,384 trillion, with daily trading volume rising 81% to IDR206.73 trillion in the last 24 hours.
Read also: Bitcoin Climbs to $69,000 Today: Can BTC Push Even Higher in April?
Ethereum Hangs Near $2,000, while $2,100 to $2,150 Remains Key Resistance
Ethereum is still moving sideways, and the chart Ted shared shows price stuck between the immediate resistance above and support below. The main upside trigger is in the range of $2,100 to $2,150, while the $2,000 level remains an important support to watch.
The resistance zone is important because the price has reacted in that area several times. The chart marks it as a clear obstacle, which means Ethereum needs to break through it to improve the short-term structure and open up space for a stronger recovery.
On the other hand, the $2,000 area currently serves as the closest support during this consolidation phase. As long as ETH stays around that level, the market remains in a sideways range and has yet to enter a confirmed breakdown scenario.
Ted also warned that if the $2,000 level is broken below, it could trigger a large long liquidation event. This view comes from the assumption that many leveraged bullish positions are likely around that support area, so a further drop could force those positions to be closed quickly.
Should that scenario occur, downside pressure could increase towards the lower support zones seen on the chart, including the green area around $1,755 and another lower level around $1,693. Conversely, if buyers are able to push ETH through the $2,100 to $2,150 area, the chart suggests that the next upside path could start forming from there.
In conclusion, the current structure is quite clear: Ethereum is still in a range bound phase, but the market is approaching an important determination point. A move through the resistance will strengthen the bullish scenario, while missing the $2,000 level could accelerate the downward pressure.
Read also: 3 Prominent Crypto RWAs that could potentially attract attention in April 2026!
Ethereum Trendline Chart Shows Long-term Uptrend Structure Despite Volatility
The chart shared by James Easton UK shows Ethereum moving inside a wide upward channel and staying afloat through several pullback phases. The lower trendline connects a number of major lows from 2022 to 2026, while the upper trendline marks the upper limit of the broader structure.
Within this framework, the chart assesses that Ethereum is still following a long-term upward path despite sharp fluctuations in between.
This reading is based on repeated bounces near the ascending support line. The chart highlights several points when Ethereum dropped towards the lower boundary of the channel and then recovered. Such reactions are important because they show that buyers entered the same structural area several times.
On the other hand, the chart also shows that Ethereum briefly moved near the upper boundary of the channel during a stronger rally. This pattern forms a broad trend channel, where the price can still correct quite deeply without completely destroying its large structure. In other words, the focus of the chart is not on short-term noise, but rather on whether the rising support line can still be maintained over time.
Nevertheless, this chart has not confirmed that a new breakout is currently underway. A long-term channel can still be considered valid, but the price still needs to continue to respect the lower limit and build strength towards the upper area. If the support fails to hold, this structure will weaken and the bullish interpretation will become less convincing.
Ultimately, this chart places Ethereum as part of a larger uptrend, rather than an unimpeded straight-up move. The most important element in this structure is the repeated defense of ascending support, which over the past few years has formed the foundation of the broader trend.
Follow us on Google News to stay up to date with the latest in crypto and blockchain technology. Check Bitcoin price, usdt to idr and tokenized nvidia stock price through Pintu Market.
As a secure crypto app, Pintu provides a crypto trading experience to access crypto gold investment easily and conveniently. You can also see today’ s gold jewelry price and today’s gold bullion price to support your investment activities and portfolio diversification as well as learn crypto through Pintu Academy.
Download the Pintu crypto app via Play Store or App Store now. Enjoy web trading experience with advanced trading tools such as pro charting, various types of order types, and portfolio tracker only at Pintu Pro.
*Disclaimer
This content aims to enrich readers’ information. Pintu collects this information from various relevant sources and is not influenced by outside parties. Note that an asset’s past performance does not determine its projected future performance. Crypto trading activities are subject to high risk and volatility, always do your own research and use cold hard cash before investing. All activities of buying and selling Bitcoin and other crypto asset investments are the responsibility of the reader.
Reference:
- Coinpaper. Ethereum Price Prediction as Range Tightens Near $2K. Accessed on April 6, 2026