Bitcoin Climbs to $71,000 Today — Here’s the Key Pattern Traders Need to Watch
Jakarta, Pintu News – Traders are now watching Bitcoin’s (BTC) movement closely as a familiar technical pattern begins to re-form. The stochastic relative strength index (RSI) on the daily timeframe is showing a move that is very similar to the conditions that emerged before the price bounce in early 2023.
This similarity caught the market’s attention, especially since the standard RSI was also starting to show signals that could point to a potential bottom forming. So, how is Bitcoin’s current price movement?
Bitcoin Price Rises 1.66% in 24 Hours
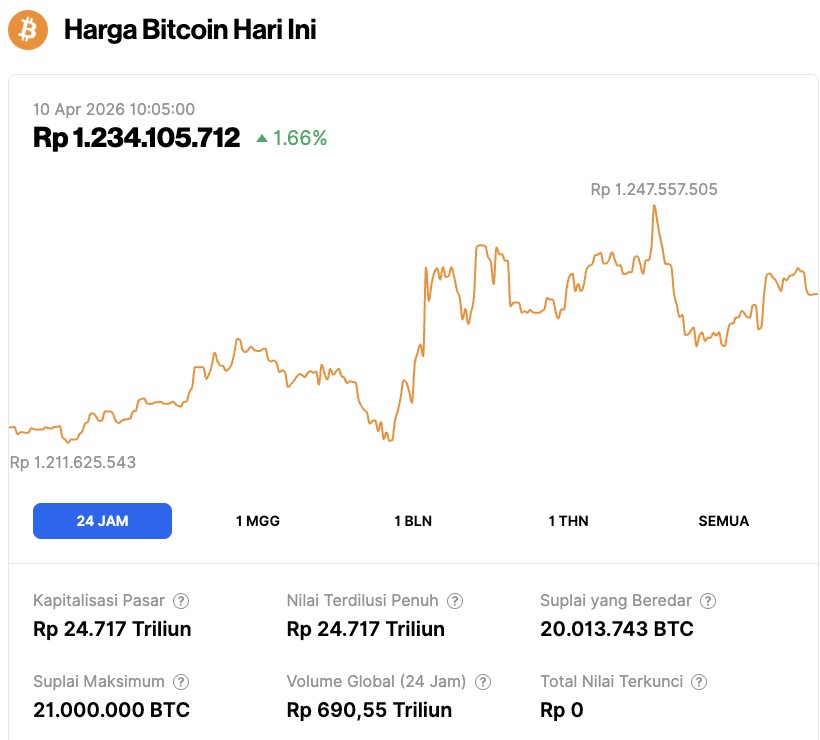
On April 10, 2026, Bitcoin traded at $71,948, or around IDR 1,234,105,712, marking a 1.66% increase over the past 24 hours. During that period, BTC fell to a low of IDR 1,211,625,543 before climbing to a high of IDR 1,247,557,505.
At the time of writing, Bitcoin’s market capitalization stood at approximately IDR 24,717 trillion, while its 24-hour trading volume declined by 1.4% to IDR 690.55 trillion.
Read also: Whale Transactions Explode in Altcoins, Smart Money Aiming for Key Areas!
Familiar Pattern Reappears on Stochastic RSI
The Stochastic RSI, which is a more responsive version of the classic Relative Strength Index, is designed to identify overbought and oversold conditions more quickly. This indicator moves in a range of 0 to 100, with readings below 30 generally signaling oversold conditions, while readings above 70 indicate overbought levels.
According to Quantum Ascend traders, the current stochastic RSI levels are almost identical to those seen in late 2022. In that period, the price movement and the indicator both formed a double bottom pattern before Bitcoin started a strong rally in early 2023.
At that time, Bitcoin hit a multi-year low around $15,600, which became the bottom of the bear market.
Now, traders think that a similar setup may form again. The indicator is attempting to break the 50 level after forming two local lows in late January and late March. If a breakout above this midpoint is confirmed, it could be a longer-term bullish signal.
RSI Divergence Adds to Bullish Expectations
In addition to the stochastic RSI, analysts also highlighted important movements on the standard RSI.
Although the price movement is still relatively weak, the weekly chart is starting to show signs of a potential bullish divergence, which is a classic signal that often appears before a reversal.
Read also: Dogecoin, Shiba Inu, and Pepe Coin Price Predictions as Bitcoin Rises to Above $71,000!
What Traders Look For Next
Trader Jelle emphasized the importance of forming a higher low on the weekly RSI. If confirmed in the coming weeks, this could strengthen the chances of a broader market recovery.
Nevertheless, risks still remain. On the daily timeframe, Bitcoin is still facing a possible breakdown of the bear flag pattern, which is a pattern that could push the price down deeper before a sustained recovery really begins.
Analyst Aksel Kibar believes that the next few days will be a crucial period to determine whether the current setup actually confirms a reversal or continues the current trend.
While historical movements rarely repeat themselves in a completely identical pattern, the appearance of aligned patterns on the stochastic RSI and the standard RSI is now gaining more and more market attention. For many traders, the convergence of these two signals suggests that Bitcoin may again be approaching a pivotal moment.
Follow us on Google News to stay up to date with the latest in crypto and blockchain technology. Check Bitcoin price, usdt to idr and tokenized nvidia stock price through Pintu Market.
As a secure crypto app, Pintu provides a crypto trading experience to access crypto gold investment easily and conveniently. You can also see today’ s gold jewelry price and today’s gold bullion price to support your investment activities and portfolio diversification as well as learn crypto through Pintu Academy.
Download the Pintu crypto app via Play Store or App Store now. Enjoy web trading experience with advanced trading tools such as pro charting, various types of order types, and portfolio tracker only at Pintu Pro.
*Disclaimer
This content aims to enrich readers’ information. Pintu collects this information from various relevant sources and is not influenced by outside parties. Note that an asset’s past performance does not determine its projected future performance. Crypto trading activities are subject to high risk and volatility, always do your own research and use cold hard cash before investing. All activities of buying and selling Bitcoin and other crypto asset investments are the responsibility of the reader.
Reference:
- Coinpaper. Bitcoin RSI Shows a Familiar Pattern From the End of the 2022 Bear Market. Accessed on April 10, 2026