Gold Prices Face Pressure From Petrodollar Effects, but Could Still Surge to $5,000 in 2026
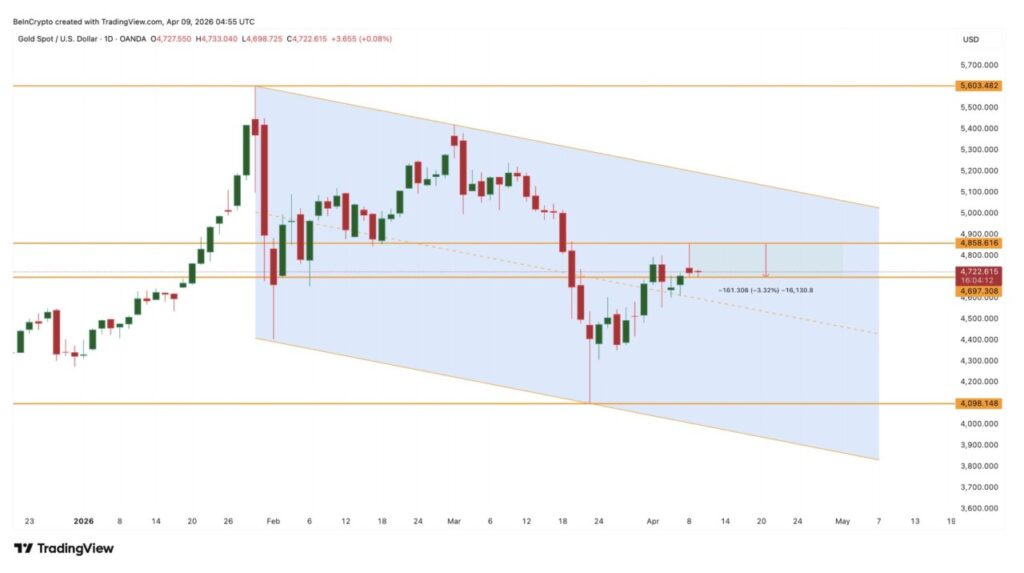
Jakarta, Pintu News – Gold prices (XAUT) briefly traded at $4,722 on April 9, down 3.32% from its peak on April 8 at $4,858, as the strengthening US dollar became a short-term drag.
This correction came after the US Dollar Index (DXY) rose 0.65% from its low of $98.52, bringing back the petrodollar effect, where the dollar tends to strengthen when oil prices recover.
However, the presence of a hidden bullish divergence, the potential to break the 20-day EMA again, as well as the bullish formation in the gold-silver ratio suggest that gold’s upward trajectory towards the level above $5,000 is still maintained, despite the weakness in intraday trading.
Gold Downward Channel vs. Dollar Upward Channel
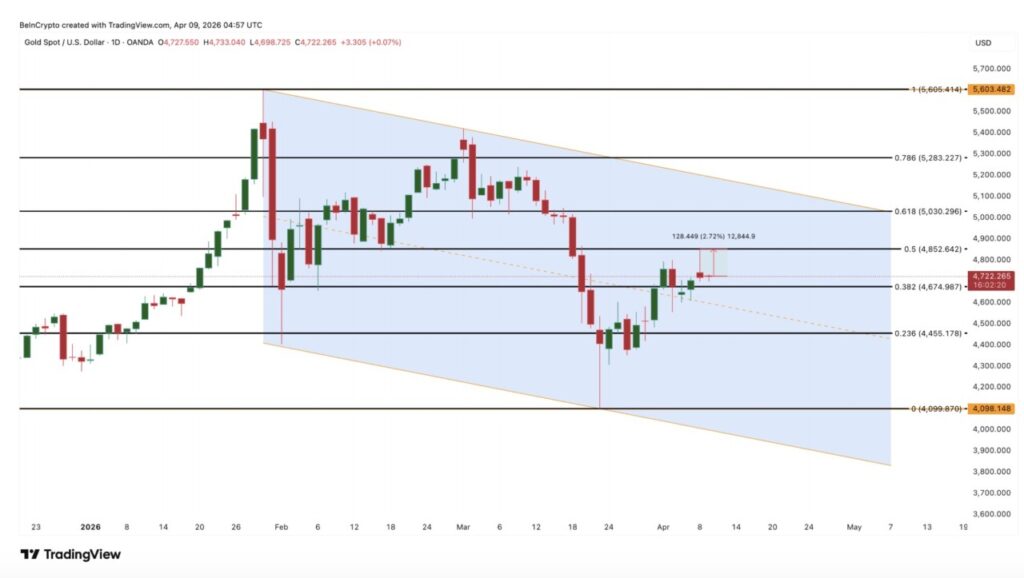
Gold prices have been moving in a descending channel pattern on the daily chart since peaking at $5,603 on January 29. The low point on March 23 at $4,098 was the deepest test of the lower area of the channel. After that, gold briefly rallied to touch $4,858 on April 8 before being pressured again by the strengthening US dollar.
Read also: 22 Karat Gold Selling Price Today, April 10, 2026
On the other hand, the movement of the DXY shows the opposite picture. The US dollar index has been moving in an upward channel for most of the 2026 period. When the ceasefire announcement was released on April 7, the DXY briefly dropped towards $98.52 and almost broke its lower trend line.
However, early violations of the ceasefire and continued uncertainty in the Strait of Hormuz pushed oil prices back up, reviving the petrodollar effect. Oil-importing countries again needed dollars to pay for crude oil, and the DXY rebounded 0.65% to $99.01.
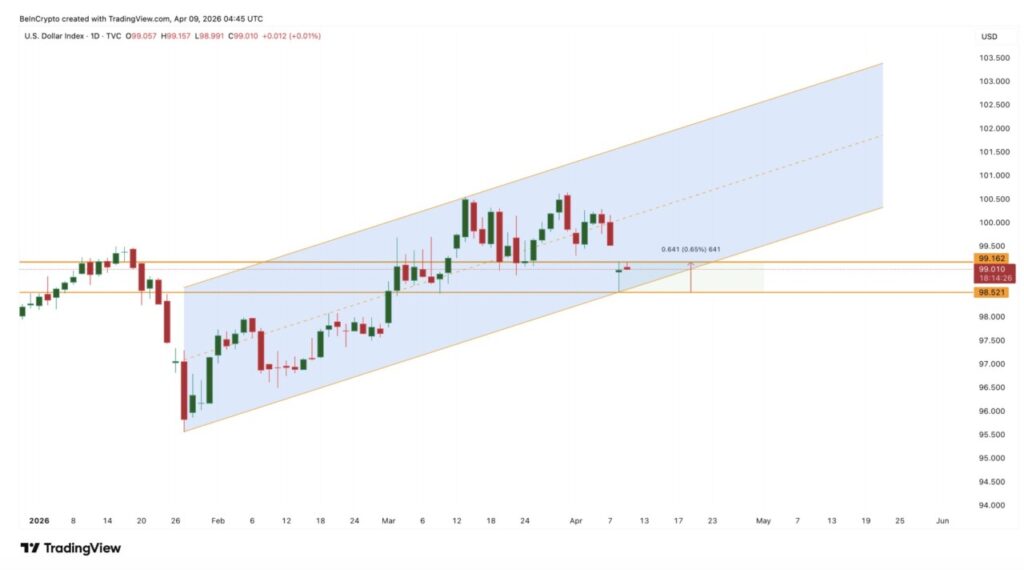
Throughout this cycle, gold and the dollar move in opposite directions. When the dollar weakens, gold tends to strengthen, and vice versa. The 3.32% drop on April 8-9 was a direct result of the dollar rebound. For gold prices to resume upward momentum, the DXY needs to break below $98.52 and exit its ascending channel. As long as that doesn’t happen, the dollar will still be the upper limit for gold’s rally.
While the pressure from the dollar is real, it is likely to be temporary. Two signals on the daily chart suggest that the upward trend that started on March 23 is not over yet.
RSI Divergence and EMA Signals Reinforce Bullish Scenario
In the period from February 2 to April 2, gold prices formed a higher low on the daily chart, while the Relative Strength Index (RSI), a momentum indicator that measures the speed of price changes, formed a lower low. This condition is known as hidden bullish divergence, which is a signal that the uptrend that started on March 23 still has the potential to continue even though the price is undergoing a correction on the surface.
This divergence is still considered valid as the price of gold has not yet dropped through its latest swing low of $4,557. As long as this level is maintained, the bullish signal is still considered active.
The Exponential Moving Average (EMA), a trend indicator that gives greater weight to recent price movements, also reinforces this view. The 20-day EMA stands at $4,721, almost the same as the current gold price position.
Meanwhile, the 50-day EMA stands at $4,780. Earlier, gold had also breached the 100-day EMA at $4,633 while rallying from the March 23 low, and has since remained moving above the level.
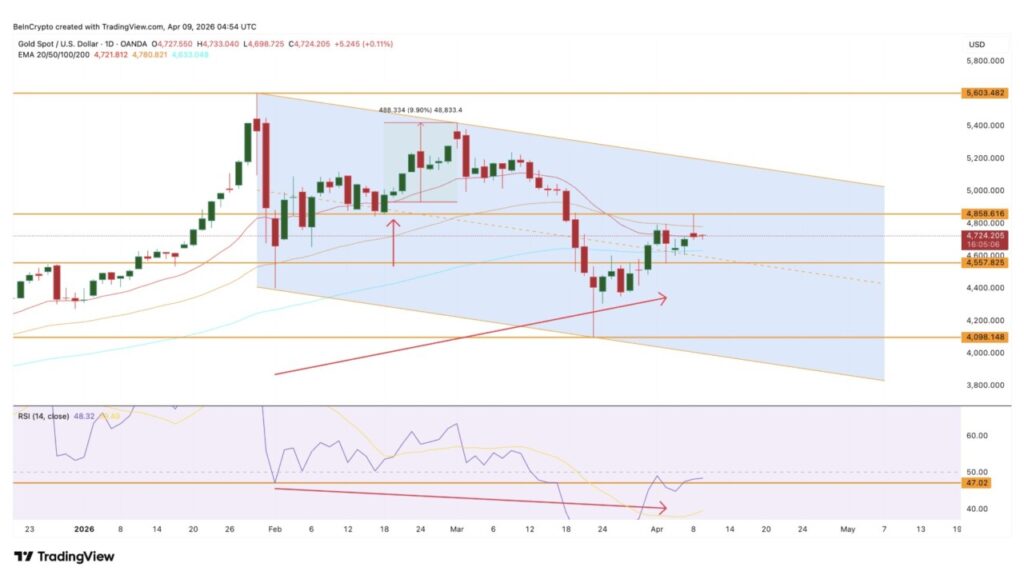
The last time gold managed to convincingly break back through the 20-day EMA was on February 18. The rally afterward resulted in a gain of around 10% before it was eventually contained. If a similar scenario plays out again now, then the chances of a comparable upside move could also open up.
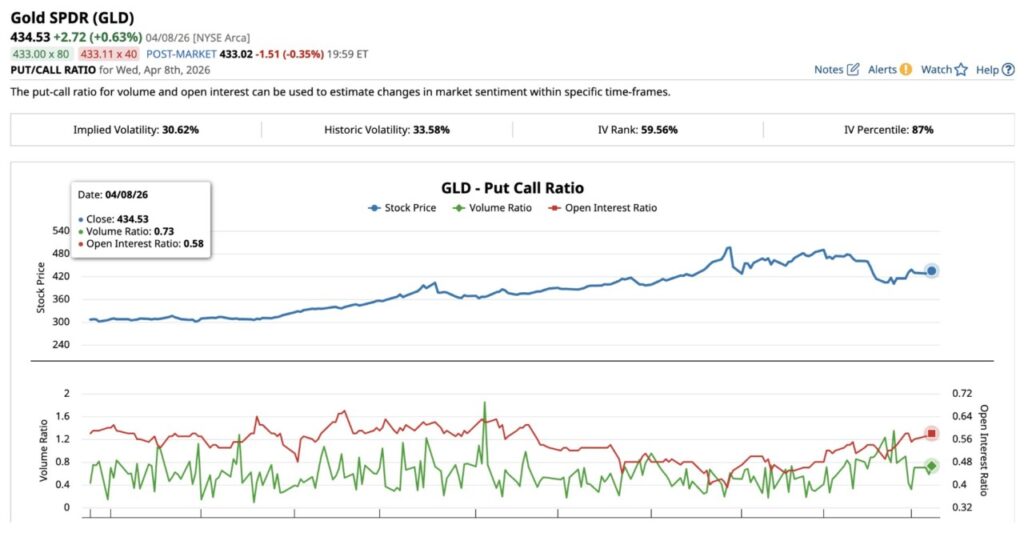
The SPDR Gold Shares (GLD) put-call ratio, a measure of options sentiment on the largest physical asset-backed gold ETF, suggests mild hedging, not market panic. The volume ratio rose from 0.58 on April 7 to 0.73 on April 8. Meanwhile, the open interest ratio edged up from 0.57 to 0.58.
Both figures are still below 1.0, which means there are still more call options than puts. This slight increase is more reflective of traders adding protective positions after the price dropped, rather than a change in belief to bearish.
Both the RSI divergence and the EMA position point to a bullish outlook. However, gold’s ability to continue to outperform is not only determined by its own chart, but also by its performance compared to silver. This is where the gold-silver ratio becomes an important final layer of analysis.
Gold-Silver Ratio Forms Bullish Structure as Gold Has a Chance to Outperform
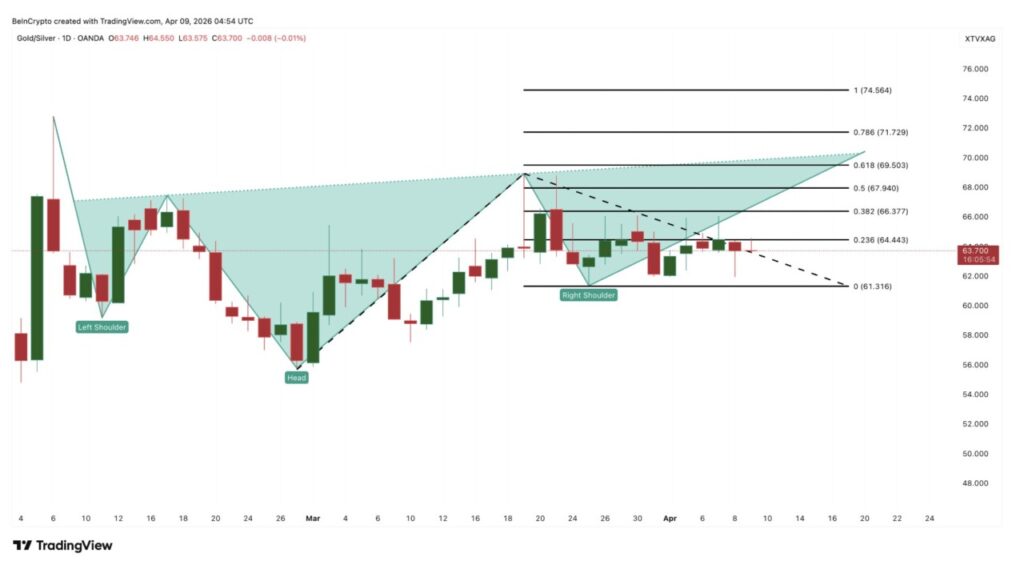
The gold-silver ratio (XAU/XAG) is at 63.70 and is forming an inverse head and shoulders pattern on the daily chart. The rising ratio indicates that gold is strengthening relative to silver.
Important levels for this ratio are at 69.50 at the 0.618 level and 71.72 at the 0.786 level. A break above 69.50 will confirm the pattern and push the ratio towards 74.56 at the 1.0 level. A ratio in the 74 area signals that gold is significantly outperforming silver, potentially attracting capital flows from silver to gold as the preferred store of value.
Read also: Antam Gold Price 12 Gram Today, April 10, 2026
This is important for gold prices because even if the dollar remains strong and both metals weaken, gold is expected to fall more limited than silver. Conversely, if the dollar breaks its channel and both precious metals rally again, gold is likely to rise more aggressively. As such, this ratio still gives gold the edge.
With bullish divergence, potential EMA reclaim, and a ratio structure that is also bullish, price action is now the main determining factor.
Gold Price Levels that Determine Whether $5,000 Can Be Reached
Gold price is currently at $4,722. The crucial immediate resistance area is at $4,852 at the 0.5 Fibonacci level, or about 2.72% above the current price. This level was the rejection point of the April 8 rally. A daily close above $4,852 would confirm the breakout and open the door to the $5,000 area.
If the price manages to break $4,852, then the first target is at the 0.618 Fibonacci level, which is $5,030, representing the $5,000 zone. If the upside continues, the next target would be at $5,283 at the 0.786 level, and then $5,605, close to the January 29 peak. For these targets to become more realistic, the DXY needs to drop through $98.52 and the gold-silver ratio needs to continue rising beyond 69.50.
On the downside, the first support is at $4,674 at the 0.382 level. Below that, the $4,455 level at 0.236 Fibonacci becomes the next support area. Meanwhile, the March 23 low at $4,098 is still the major lower limit. If the price drops through the swing low at $4,557, the hidden bullish divergence on the RSI will be invalidated, and the short-term bias will turn bearish.
Based on the current chart structure, the $4,852 level becomes an important barrier between a confirmed breakout towards the $5,000 zone or a continuation of the correction towards $4,674 with a possible retest of the $4,455 support.
Crypto Gold Investment Starting from Rp11,000
As blockchain technology develops, gold can now be owned not only in physical form such as jewelry or bars, but also in digital form through gold-based crypto assets.
Crypto gold offers a more flexible, practical, and modern way of investing in gold than physical gold. Some of the advantages of crypto gold investment in Pintu are:
- Start investing from a small amount of Rp11,000.
- Can be traded anytime 24/7.
- Price spreads are lower than physical gold.
- It is safe because it is licensed and supervised by OJK.
- Purchases are easy and can be scheduled automatically.
- It can be sent between wallets quickly and conveniently.
Follow us on Google News to stay up to date with the latest in crypto and blockchain technology. Check Bitcoin price, usdt to idr and tokenized nvidia stock price through Pintu Market.
As a secure crypto app, Pintu provides a crypto trading experience to access crypto gold investment easily and conveniently. You can also see today’ s gold jewelry price and today’s gold bullion price to support your investment activities and portfolio diversification as well as learn crypto through Pintu Academy.
Download the Pintu crypto app via Play Store or App Store now. Enjoy the web trading experience with various advanced trading tools such as pro charting, various types of order types, and portfolio tracker only at Pintu Pro.
*Disclaimer
This content aims to enrich readers’ information. Pintu collects this information from various relevant sources and is not influenced by outside parties. Note that an asset’s past performance does not determine its projected future performance. Crypto trading activities are subject to high risk and volatility, always do your own research and use cold hard cash before investing. All activities of buying and selling Bitcoin and other crypto asset investments are the responsibility of the reader.
Reference:
- BeInCrypto. Gold Price Takes a Petrodollar Hit, but the $5,000 Setup Survives. Accessed on April 10, 2026