Bitcoin Price Today (14/4): Ready to Break $80,000 in April? Here’s the Analysis!
Jakarta, Pintu News – Bitcoin (BTC) is back in the spotlight after breaking through the $73,000 level at the opening of Wall Street on Friday. This price surge has sparked renewed optimism among investors and analysts, who are now starting to predict a potential further rise to $80,000 by April.
A number of technical indicators, onchain data, and changes in market sentiment reinforce the possibility of a further rally. Here’s a full review of the factors that could push Bitcoin (BTC) towards the next psychological level.
Bitcoin (BTC) Breaks Bearish Pattern, Strong Signal for Positive Trend
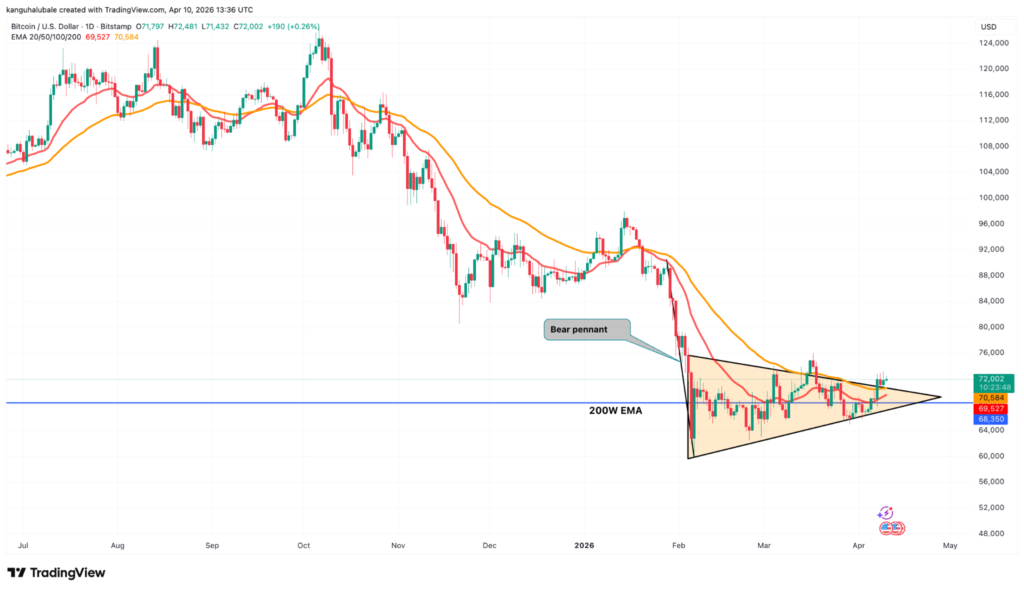
Earlier this week, Bitcoin (BTC) managed to invalidate the bear pennant pattern that had previously threatened the uptrend on the daily chart. Price action that breached the upper trendline at $70,000, followed by a surge in trading volume, was a strong signal that buying pressure was dominating. Within a short period of time, Bitcoin (BTC) price surged by 7% and recorded a six-week high of $73,300.
This success was also accompanied by the retaking of several important support lines, such as the 200-week EMA at $68,350, the 20-day EMA at $69,520, and the 50-day EMA at $70,580. A symmetrical triangle pattern is now starting to form, signaling a greater potential for a bullish reversal. Symmetrical triangles usually occur when the price forms a lower high and a higher low, and then moves within a narrowing range.
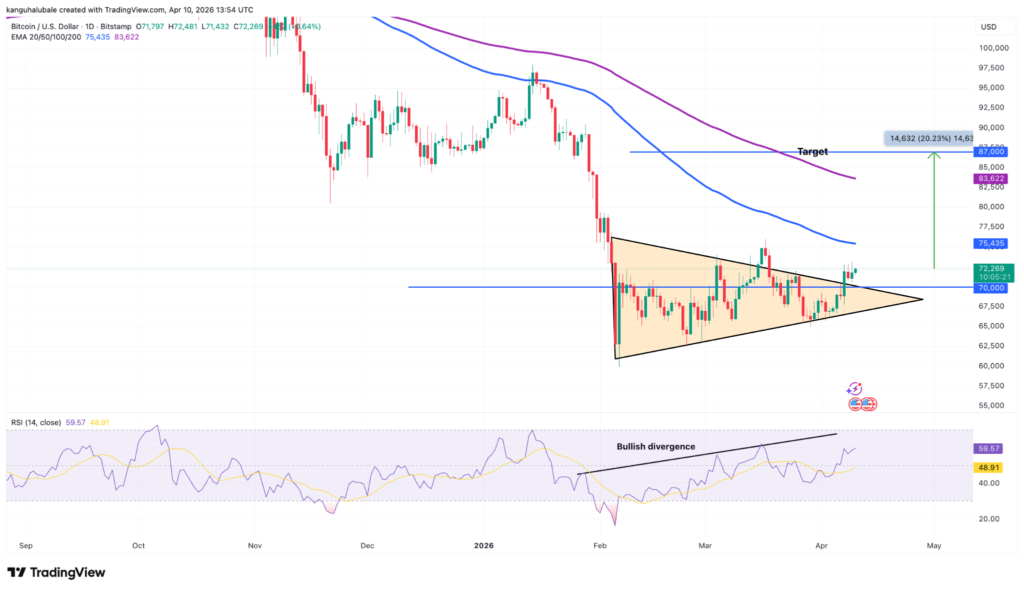
If the price manages to break one of the trend lines, the upside potential could reach as high as the pattern, which in the case of Bitcoin (BTC) leads to $87,000 or about 20% above the current price. The RSI indicator is also showing a bullish divergence, signaling a steadily strengthening upward momentum over the past two months.
Read also: 1 Gram Gold Ring Price Today, April 14, 2026
Onchain Data: Bitcoin (BTC) Upside Potential Capped at $80,000
Over the past six-plus weeks, Bitcoin (BTC) has consolidated in the $60,000 to $70,000 range, with several failed attempts to hold above $72,000. Data from Glassnode shows strong resistance between the true average market price at $78,000 and the short-term holding cost level around $80,000.
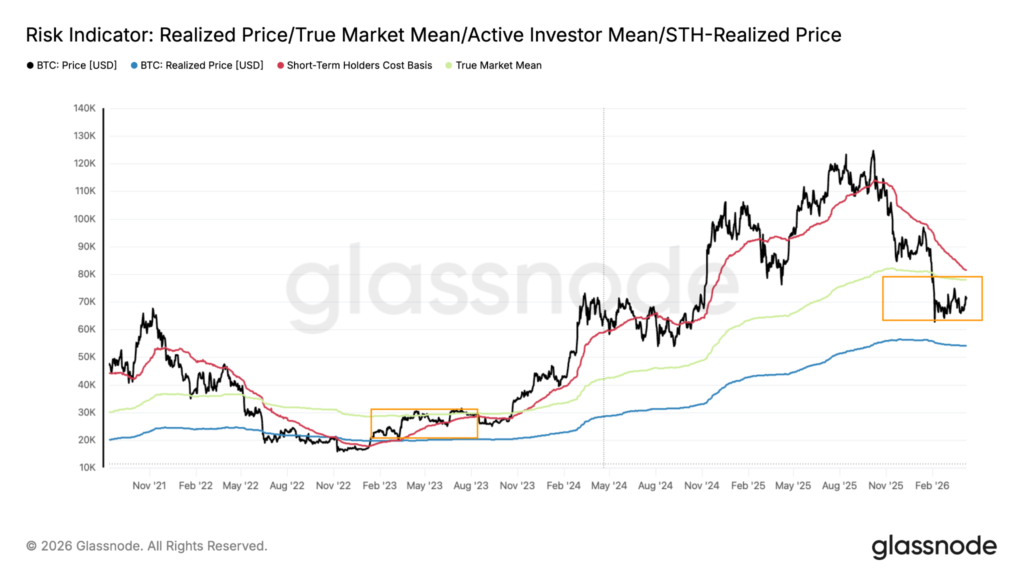
This level is an important threshold that could limit the rate of increase in the near future, as it did in 2023. Glassnode’s Entity-Adjusted UTXO Realized Price Distribution (URPD) analysis reveals that Bitcoin (BTC) price is now in an open zone between $72,000 and $82,000, where selling pressure is relatively low.
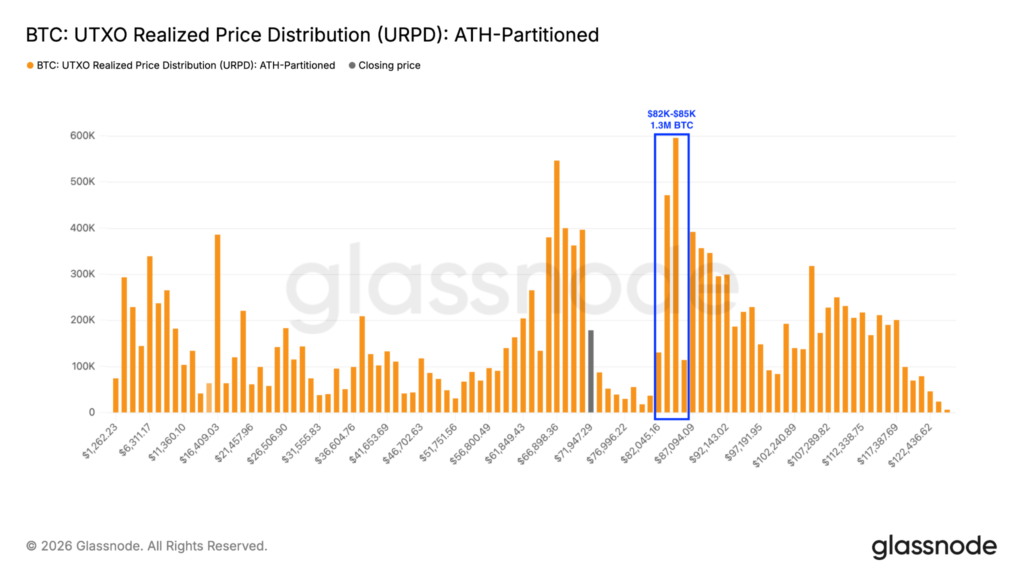
This opens up opportunities for Bitcoin (BTC) to move more freely within the range as long as momentum is maintained. However, the cost basis distribution shows a large accumulation between $78,000 to $84,000, which could potentially be an area of strong resistance and limit the upside in the $82,000-$85,000 range. More than 1.3 million Bitcoins (BTC) were recorded changing hands in that price area.
Read also: 22 Karat Gold Selling Price Today, April 14, 2026
Polymarket Predictions: Chances of Bitcoin (BTC) Touching $80,000 in April Increase
Polymarket, a crypto-based prediction platform, noted a surge in optimism towards the possibility of Bitcoin (BTC) reaching $80,000 in April. Currently, traders on Polymarket give a probability of 26% for that scenario, up 5% compared to the previous day. Meanwhile, the $75,000 price target has even more confidence with a 76% probability.
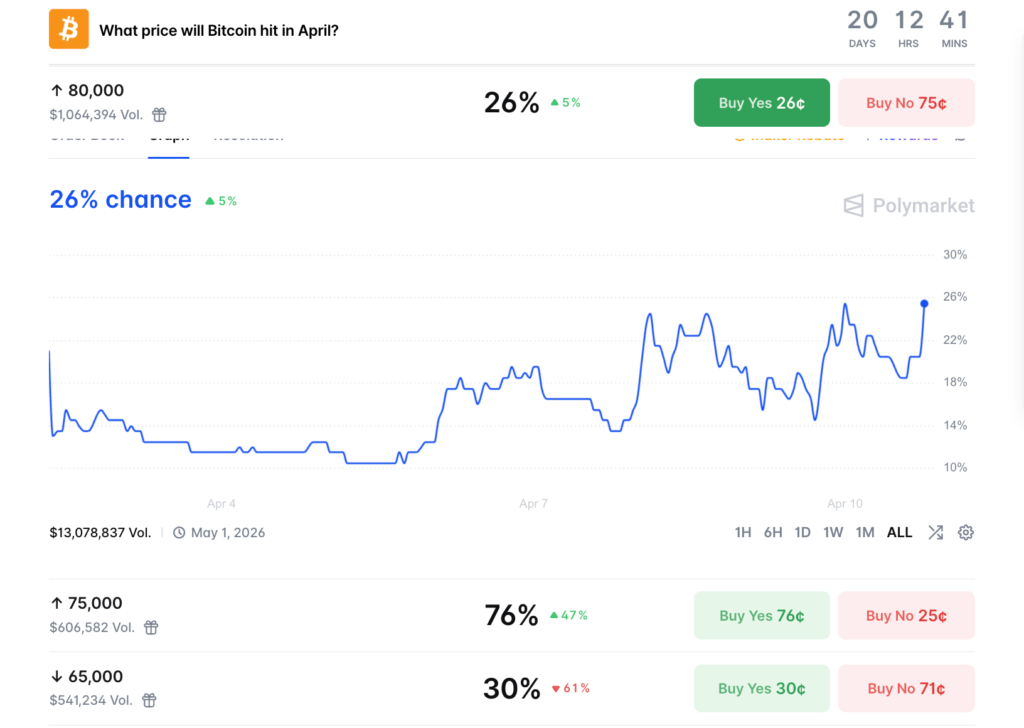
On the other hand, the chances of Bitcoin (BTC) dropping to $65,000 in the same month are getting smaller, signaling more bullish market expectations. This change in sentiment is driven by a combination of technical and fundamental factors that favor an upward trend.
If momentum is maintained, Bitcoin (BTC) has the potential to break through the next psychological level in the near future. However, investors still need to be wary of a potential correction in case of rejection at the key resistance area.
Follow us on Google News to stay up to date with the latest in crypto and blockchain technology. Check Bitcoin price, usdt to idr and tokenized nvidia stock price through Pintu Market.
As a safe crypto app, Pintu provides a crypto trading experience to access crypto gold investment easily and conveniently. You can also see today’ s gold jewelry price and today’s gold bullion price to support your investment activities and portfolio diversification as well as learn crypto through Pintu Academy.
Download the Pintu crypto app via Play Store or App Store now. Enjoy the web trading experience with various advanced trading tools such as pro charting, various types of order types, and portfolio tracker only at Pintu Pro.
*Disclaimer
This content aims to enrich readers’ information. Pintu collects this information from various relevant sources and is not influenced by outside parties. Note that an asset’s past performance does not determine its projected future performance. Crypto trading activities are subject to high risk and volatility, always do your own research and use cold hard cash before investing. All activities of buying and selling Bitcoin and other crypto asset investments are the responsibility of the reader.
Reference
- Cointelegraph. Bitcoin charts point to $80K in April – Here’s how it may happen. Accessed on April 14, 2026
- Featured Image: Generated by AI