As Ethereum Holds Steady at $2,300 Today, Is a Surge to $3,000 on the Horizon?
Jakarta, Pintu News – Ethereum (ETH) is getting closer to a breakout, and the current state is starting to attract serious attention. After weeks ofsideways movement, ETH is now pressuring key resistance levels, while subtle shifts below the surface suggest that buyers are gradually starting to take control.
With momentum starting to shift and price holding strong, a question is now taking center stage. Can the Ethereum price turn this momentum into a breakout and drive towards $3,000?
Ethereum Price Drops 1.02% in 24 Hours
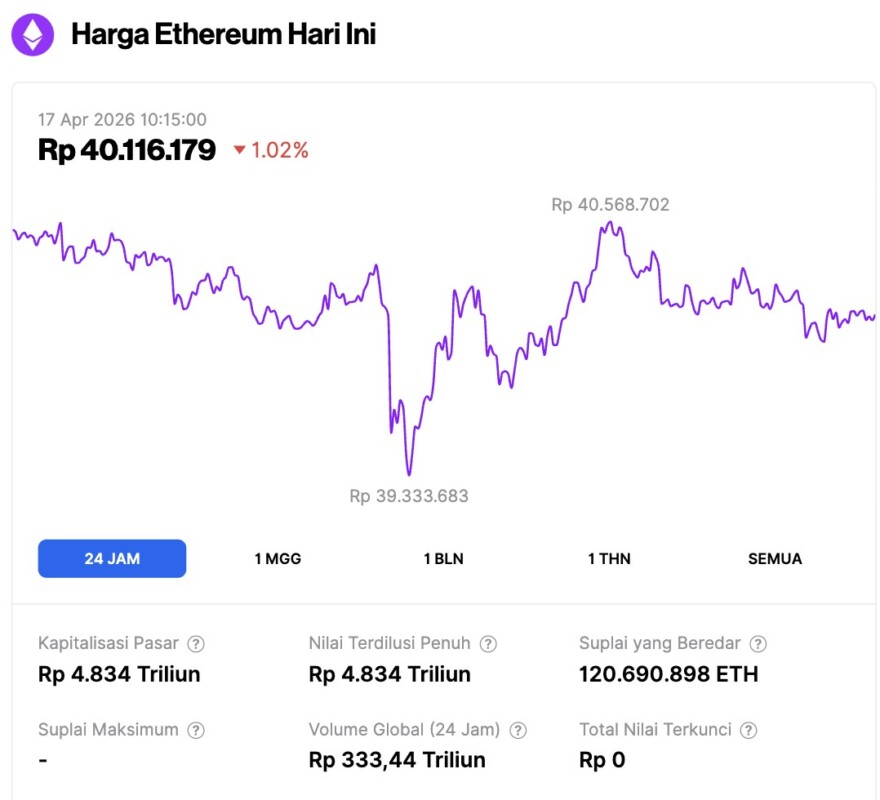
On April 17, 2026, Ethereum experienced a slight pullback, slipping 1.02% over the past 24 hours to trade at approximately $2,328 (roughly IDR 40,116,179). Throughout the day’s trading session, the cryptocurrency navigated a relatively tight range, finding a local bottom at IDR 39,333,683 before peaking at IDR 40,568,702.
Despite the minor dip in price, market participation remains robust. As of this writing, Ethereum commands a massive market capitalization of about IDR 4,834 trillion. This strong valuation is backed by a notable 20% surge in daily trading activity, pushing the 24-hour trading volume up to an impressive IDR 333.44 trillion.
Read also: Bitcoin Retreats to $74,000 as Exchange Inflows Surge to 11,000 BTC
Bullish Divergence Signals Accumulation In Progress
Ethereum’s current state is reinforced by a clear shift in derivative behavior. Data shows that the 14-day SMA of the taker buy/sell ratio has risen to above 1.03, marking one of its strongest figures in recent years. A ratio above 1 indicates thatbuy orders dominatesell orders, a sign that aggressive buyers are actively entering the market.
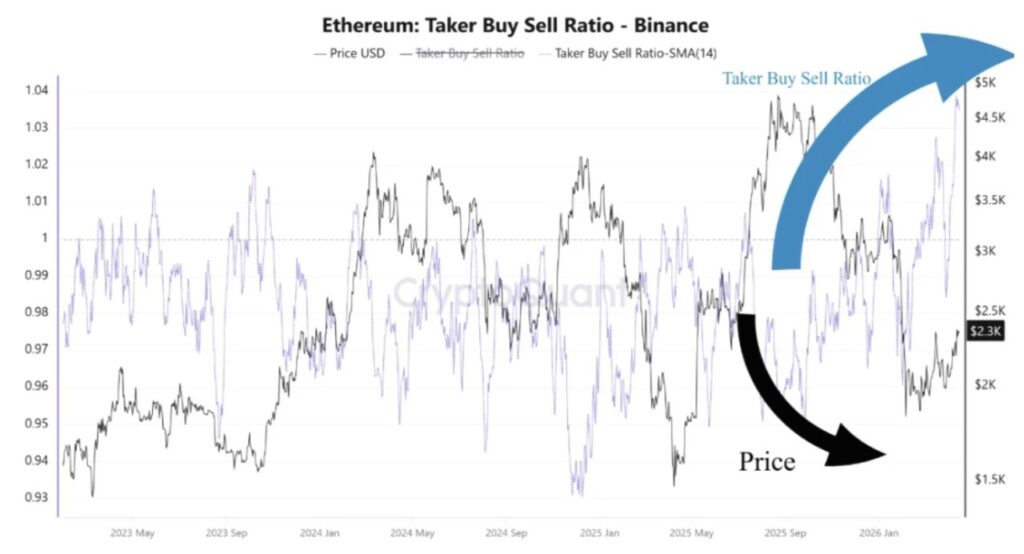
Although ETH is trading well below its previous high, buyers are stepping in with confidence, which suggests that the current phase is being treated as an accumulation zone instead of a continuation of the weakening trend.
This creates a classic bullish divergence, where prices remain relatively restrained, but underlying demand continues to strengthen. Historically, such conditions often appear before the start of areversal phase or broader expansion.
On-Chain Activity Stabilizes as Selling Pressure Eases
In addition to derivatives, on-chain data has also started to show early signs of stabilization. Metrics such as active addresses and network growth have stopped declining and are now movingsideways, indicating that participation is no longer weakening. While this does not yet reflect aggressive expansion, it does signal that the market may be transitioning out of its previousdowntrend phase.
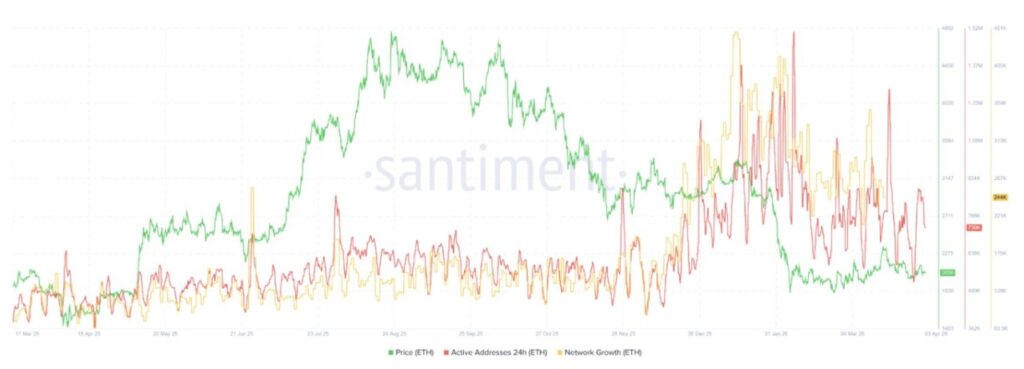
As network activity stabilizes alongside increased buying pressure, it shows that weaker participants start to exit whilestronger hands gradually accumulate. This creates a more balanced market structure, wheredownside risk begins to diminish over time.
Simply put, the foundation is starting to be rebuilt, even if the price hasn’t reacted fully.
Ethereum Price Analysis: Breakout Formation Forms as Buyers Take Control
Ethereum’sprice action is now entering a decisive phase, with the structure tightening as buyers continue to defend key levels.
Read also: Ethereum Breaks the Market! Record 3.62 Million Transactions Per Day, ETH Ready for IDR 1 Billion?
The ETH price chart shows that ETH is holding firm within thedemand zone around $2,100-$2,200, where repeated buying has prevented further declines. This zone effectively acts as abase, allowing the price to stabilize and gradually formhigher lows.
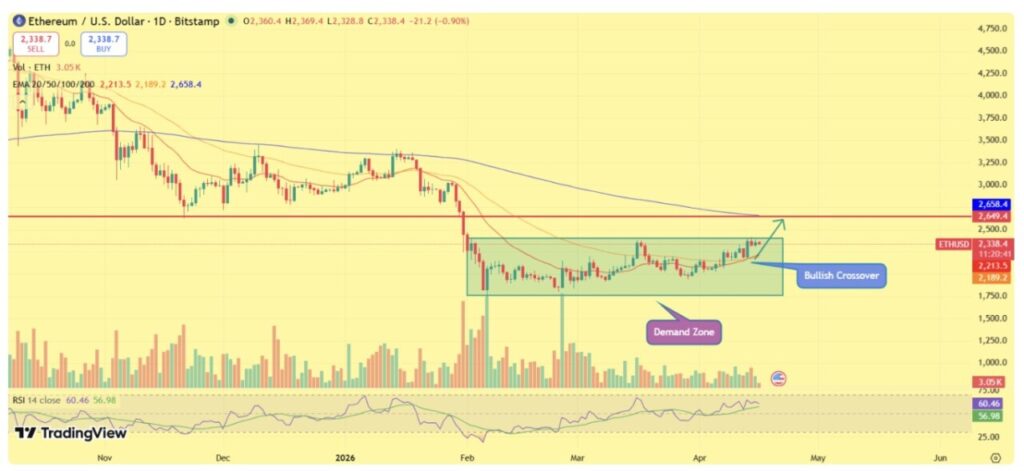
At the same time, Ethereum is now pressuring thedescending trendline resistance, which has been limiting the price for a long time. Repeated tests of this level, without a strongrejection, indicate that selling pressure is starting to weaken.
This is where things get interesting. When prices hold near resistance instead of experiencing apullback, it often signals that buyers are preparing for a breakout rather than exiting their positions.
On the upside, the nearest hurdle is around the $2,600-$2,750 zone. A clean breakout and the ability to hold above this level could accelerate the momentum and open the way towards $2,900-$3,000 in the short term.
On the downside, the $2,100-$2,200 demand zone remains a critical level. Abreakdown below this area will weaken the price structure, but as long as the level is maintained, the bullish formation will be maintained.
ETH Price Outlook: Breakout May Determine Ethereum’s Next Move
Ethereum is approaching a pivotal moment where its technical structure and underlying data are starting to align. Increasing buy-side pressure, stable on-chain activity, and a clearly defineddemand zone all point to a market that is quietly strengthening beneath the surface.
However, the confirmation still depends on a convincing breakout above the resistance level. If buyers manage to push ETH higher and maintain its momentum, a move towards $3,000 becomes increasingly likely.
Until then, Ethereum remains in abuild-up phase, but pressure is clearly building, and the next move could determine the direction of the market for the next few weeks.
Follow us on Google News to stay up to date with the latest in crypto and blockchain technology. Check Bitcoin price, usdt to idr and tokenized nvidia stock price via Pintu Market.
As a safe crypto app, Pintu provides a crypto trading experience to access crypto gold investment easily and conveniently. You can also see today’ s gold jewelry price and today’s gold bullion price to support your investment activities and portfolio diversification as well as learn crypto through Pintu Academy.
Download the Pintu crypto app via Play Store or App Store now. Enjoy web trading experience with advanced trading tools such as pro charting, various types of order types, and portfolio tracker only at Pintu Pro.
*Disclaimer
This content aims to enrich readers’ information. Pintu collects this information from various relevant sources and is not influenced by outside parties. Note that an asset’s past performance does not determine its projected future performance. Crypto trading activities are subject to high risk and volatility, always do your own research and use cold hard cash before investing. All activities of buying and selling Bitcoin and other crypto asset investments are the responsibility of the reader.
Reference:
- Coinpedia. Ethereum Price Nears Breakout: Can ETH Rally Toward $3,000 Next? Accessed on April 17, 2026