Market Analysis: 21-27 November 2022: Recession Forecast and BTC Movement

analisis pasar 21-27 November 2022
Several indicators show the possibility of a global recession will likely hit next year. This condition certainly has a massive influence on the movement of the equity and crypto market.
Pintu’s team of traders has collected various important data about the movement of the crypto market over the past week, which is summarized in this Market Analysis. However, you should note that all the information in this Market Analysis is for educational purposes, not financial advice.
Market Analysis Summary
- 🌐 Leading Economic Indicator signals that March 2023 might be the start of a recession.
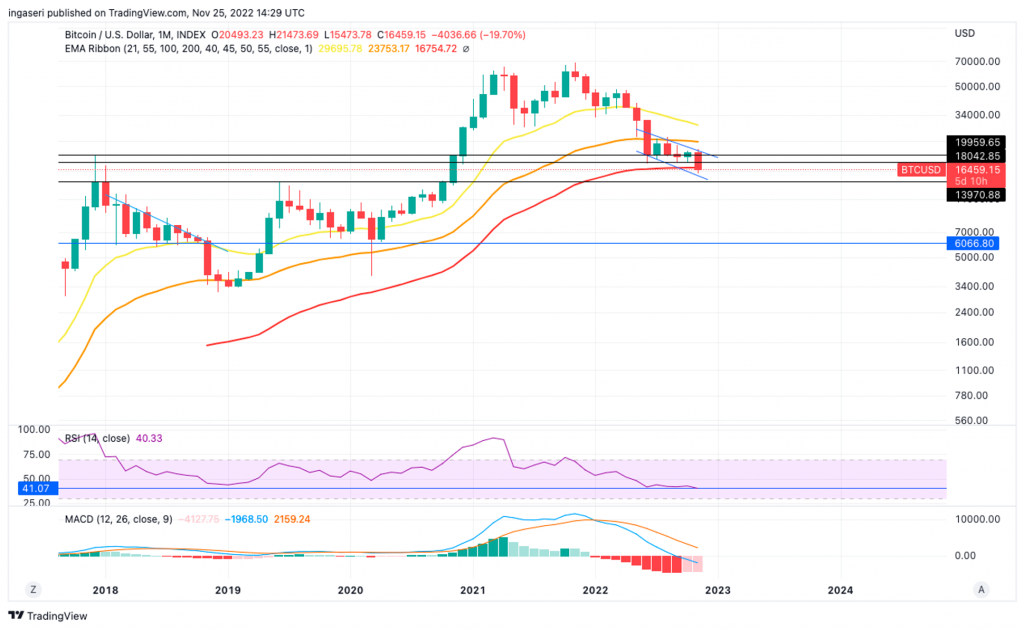
- 📊 BTC is still within bottom channel of the bearish falling wedge, expect a short term reversal to the upside.
- 📉 Grayscale Bitcoin Trust (GBTC) is trading at a discount of 40% to BTC.
Macroeconomy Analysis
Now that the midterm elections have been finalized, with the Democrats retaining control of the senate and the republicans taking a narrow majority in the house, the result of a mixed government typically signals a market-friendly overall. Markets do not usually react well to uncertainty, and with the political gridlock outcome, this is normally considered as favorable outcome as new measures are being thwarted by the opposing party.
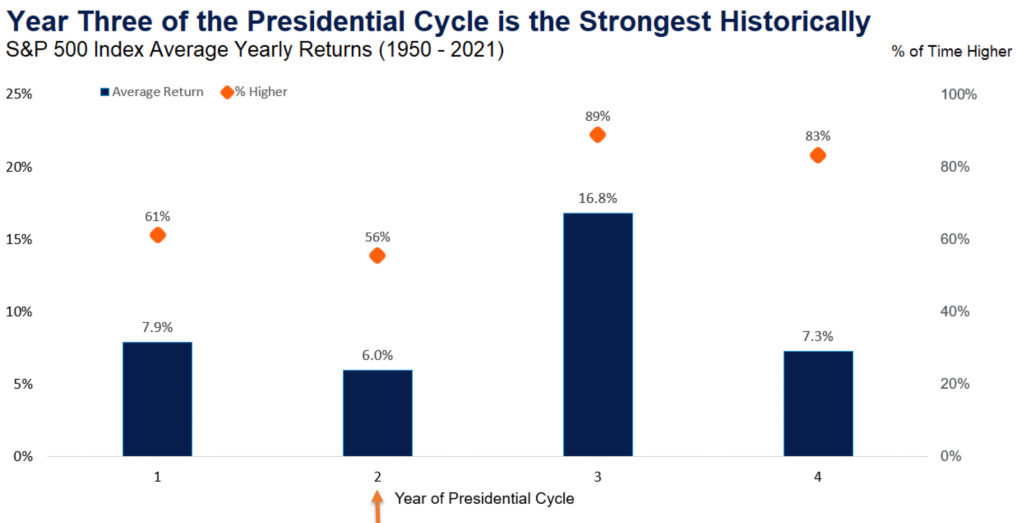
Also, coming into the third year of presidency has historically show the strongest return for equity market of all the presidential cycles. The third year of presidency has returned almost 17% and been positive 89% of the years since 1950, more than any other year of the cycle.
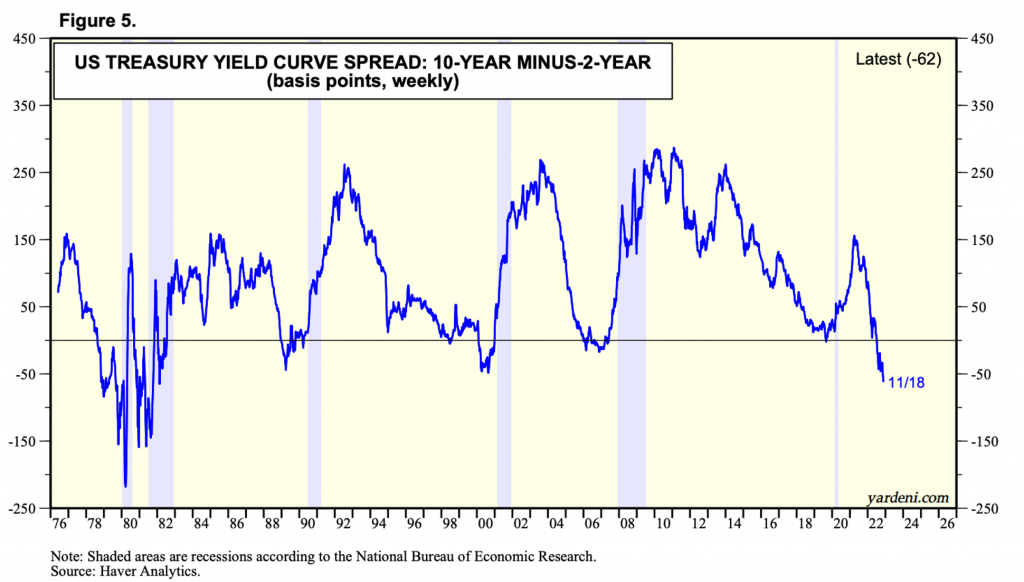
We are wary of the potential recession that is coming our way. Based on the yield curve inversion, the past six times the 2Y/10Y part of the yield curve inverted, and a recession followed. This occurs between 6-36 months later. Notice that the curve is inverted beginning June 2022. Should we follow the historical data, we should be prepared for a recession anywhere between the start of 2022 and mid-2024.
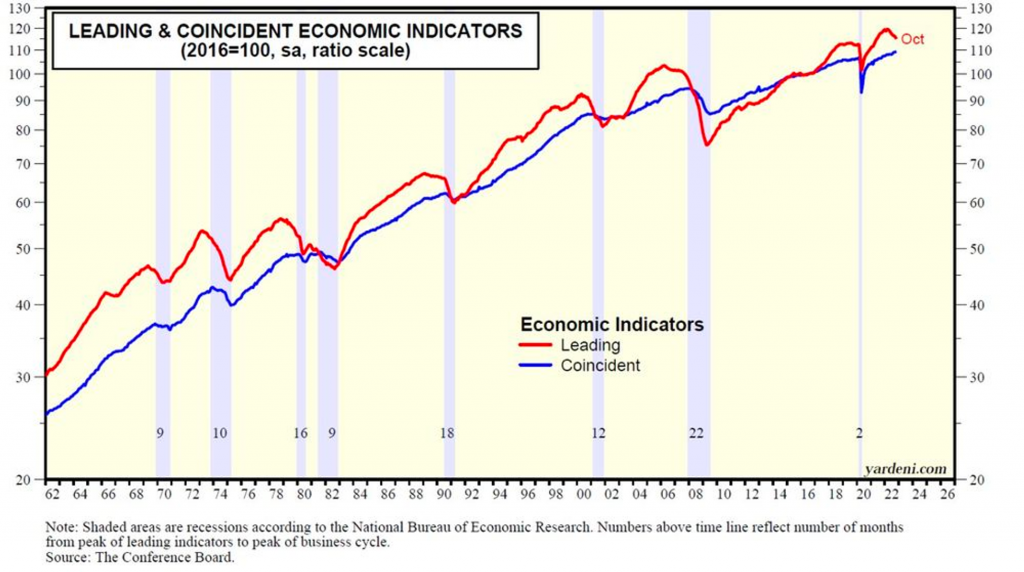
Another indicator is the Leading Economic Indicator. Shown below is the Index of Leading Economic Indicators which peaked at the beginning of the year and is down over the past eight months through October. Historically it has a good track record of signaling past recessions that coincide with the peak of the Coincident Economic Indicator. On Average, it peaked about 14 months before the peak in the Coincident Economic Indicator (CEI). This would put approximately March next year as the start of the recession.
Bitcoin Price Movement 21-27 November
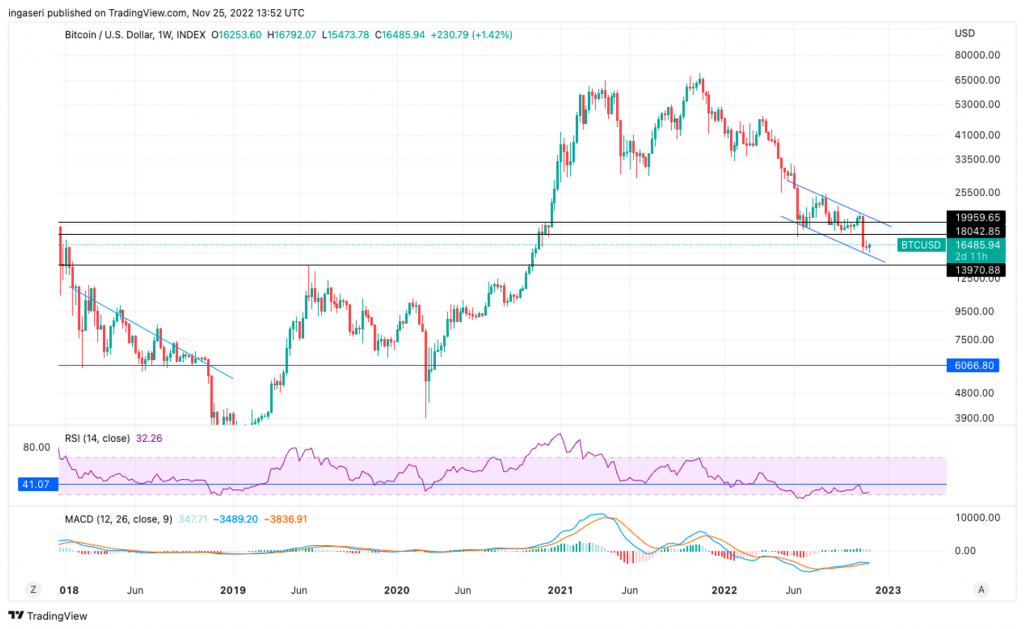
BTC has bounced from its lows of 15,800 to the current price of 16,500. It tried crossing over the 17K price point but was met with resistance. Generally, BTC is still within bottom channel of the bearish falling wedge, expect a short term reversal to the upside. Expect price to be within the channel moving sideways.
On the monthly chart, BTC is below the 100 month EMA. Historically, we have never venture below the 50 months EMA, and yet we are seemingly to be breaking below the 100 month EMA support line. We have to see until the end of the month whether we are able to retain the line as support. Also notice the RSI support line at 41, we have never gone down below the support line. We are currently treading at the edge of this support line.
There is still uncertainty in the crypto market. With the FTX fallout and its contagion to Genesis, crypto prices have been kept at bay throughout the week. Genesis is part of DCG group, which owns Grayscale investments and runs the GBTC fund. Notice that the GBTC is trading at a discount of 40% to BTC.

On-Chain Analysis
📊 Exchange: As the exchange reserve continues to fall, it indicates lower selling pressure. Net deposits on exchanges are low compared to the 7-day average. Lower deposits can be interpreted as lower selling pressure.
💻 Miners: Miners are selling holdings in a moderate range compared to its one-year average. Miner’s revenue is decreasing significantly compared to the cost they put in. This could indicate that the price is undervalued along with the increasing miner’s motive to hold their coins.
🔗 On-chain: More investors are selling at a loss. In the middle of a bear market, it can indicate a market bottom. Long-term holders’ movement in the last 7 days was higher than the average. If they were moved for selling, it may have negative impact. Investors are in a capitulation phase where they are currently facing unrealized losses. It indicates the decreasing motive to realize loss which leads to a decrease in sell pressure.
🏦 Derivatives: Long position traders are dominant and are willing to pay to short traders. Selling sentiment is dominant in the derivatives market. More sell orders are filled by takers. As OI increases, it indicates more liquidity, volatility, and attention are coming into the derivative market. The increasing trend in OI could support the current ongoing price trend.
Altcoin News
- The Argentina’s fan token, ARG, plunged 36% in two hours on Tuesday, November 22, 2022. This fan token dropped after Argentina surprisingly defeated by Saudi Arabia 2-1. Meanwhile, the Spanish National Fan Token (SNFT) price increased by 46% after Spain demolished Costa Rica 7-0 on Wednesday, November 23, 2022.
- Shiba Inu payments are expanding to more merchants globally. SHIB holders can use their tokens to pay Atheis Shoes via BitPay and enjoy extra 10% off discount. Also, HOSTKEY, a website server provider, has also announced the acceptance of SHIB token for its customers.
More News from Crypto World in the Last Week
- Japan’s central bank has started planning a central bank digital currency (CBDC) experiment. The Bank of Japan is working with three megabanks as well as regional banks. The BOJ’s experiment will explore how deposits and withdrawals can work with a digital yen. If all goes according to plan, the BOJ may go ahead and release a CBDC in 2026.
- A Bored Ape Yacht Club NFT sold for 800 ETH or 927.000 US dolars on Thursday, November 24,2022. The Gold-Furred Ape #232 was sold by Chain CEO, Deepak Thapliyal. Even while the majority of NFT market prices are falling, some blue chip Ethereum NFT continue to command high prices.
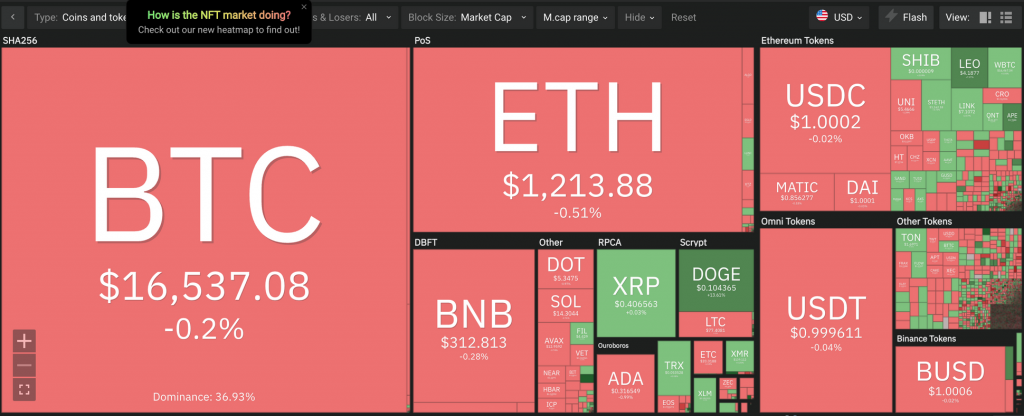
Cryptocurrencies Market Price Over the Past Week
Cryptocurrencies With the Best Performance
- Huobi Token (HT) +67.2%
- Celo (CELO) +41.49%
- Curve DAO Token (CRV) +37.08%
Cryptocurrencies With the Worst Performance
- Chiliz (CHZ) -24.90%
- Chain (XCN) -16.11%
- Algorand (ALGO) -12.60%
Reference
- Mat Di Salvo, Japan Kicks Off Central Bank Digital Currency Experiment, Decrypt, accessed 25 November 2022.
- Tomiwabold Olajide, Shiba Inu (SHIB) Accepted as Payment by This Berlin-based Footwear Maker: Details, Utoday, accessed 26 November 2022.
- Vladislav Sopov, Argentina’s ARG Fan Crypto Plunges by 36% on First FIFA World Cup Sensation, Utoday, accessed 26 November 2022
- Andrew Hayward, NFTs Are Dead? Even in Bear Market, a Bored Ape Sells for Nearly $1 Million, Decrypt, accessed 27 November 2022
Share


