Market Analysis July 24-30: BTC Price Climbs Post Fed Meeting
The price of Bitcoin gradually increased after the Fed, the central bank of the United States, raised interest rates last week. Pintu’s team of traders has collected data about Bitcoin price movements and the crypto market in general over the past week, which is summarized in the Market Analysis below. However, kindly note that all information from the market analysis below is for educational and informational purposes only, and not financial advice.
Article Summary
- 📈 The Fed raised interest rates (Fed Funds Rate / FFR) by 75 bps on Thursday last week.
- 🚀 BTC price rose after the Fed rate hike was announced and managed to surpass the historically strong support line, the 200 MA line.
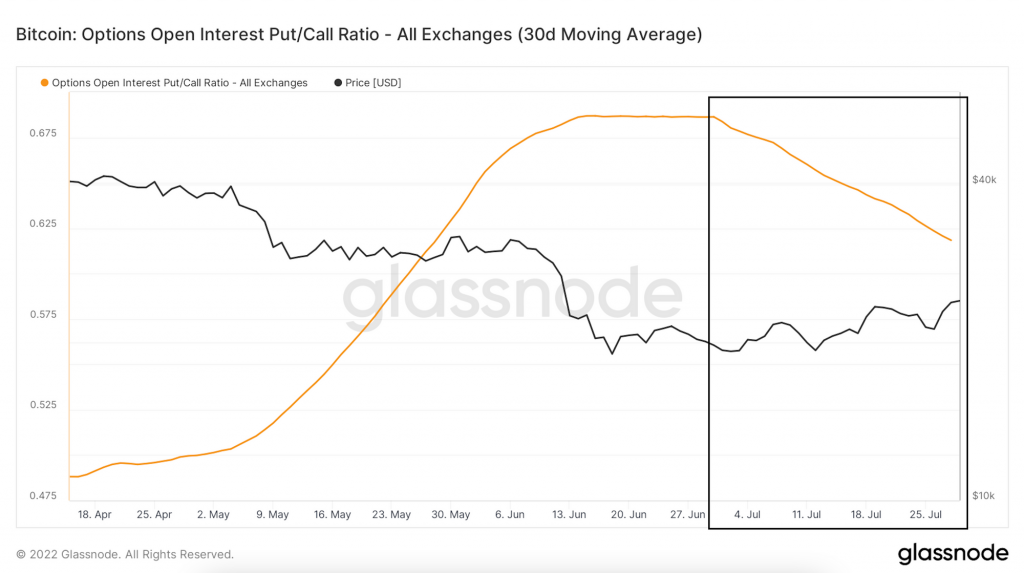
- 🔎 Put to call ratio BTC continued its downward trend throughout July, indicating the market’s level of confidence in the BTC price is increasing.
BTC Price Movement 24-30 July 2022
The Fed raised the Fed Funds rate by another 75 bps on Thursday, thus taking its target rate to 2.25-2.5%. The plan is to curb inflation without creating a recession. US GDP shrinks for 2 quarters in a row. This means that the US is in a technical recession. The economy shrank at a 0.9% pace between April and June for a second straight quarter. We saw a 1.6% annual drop for January-March previously.
The Fed chairman, Powell said that he does not think the economy is in recession; job gains have been robust, the unemployment rate is low and the labor market has been very strong.
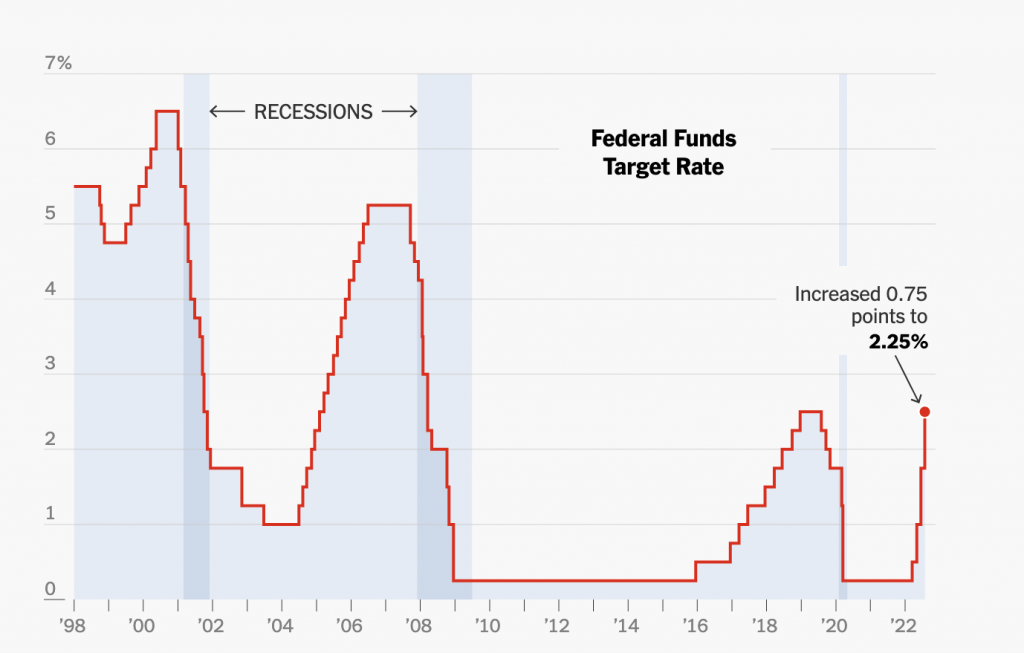
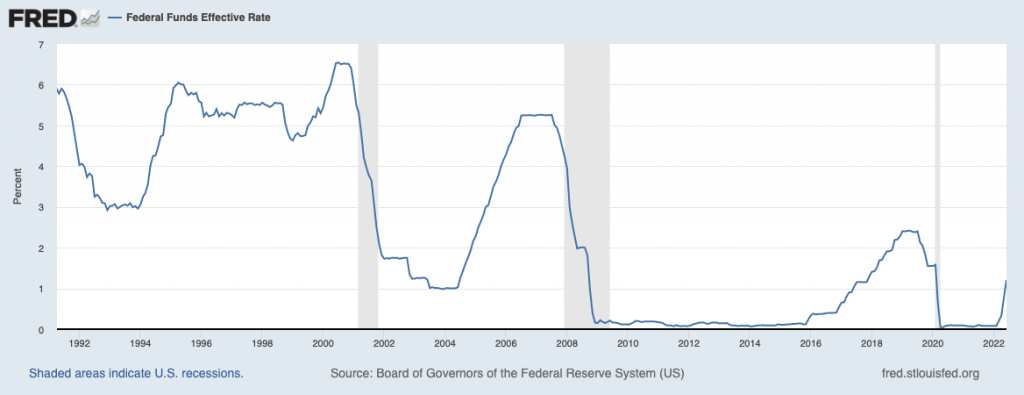
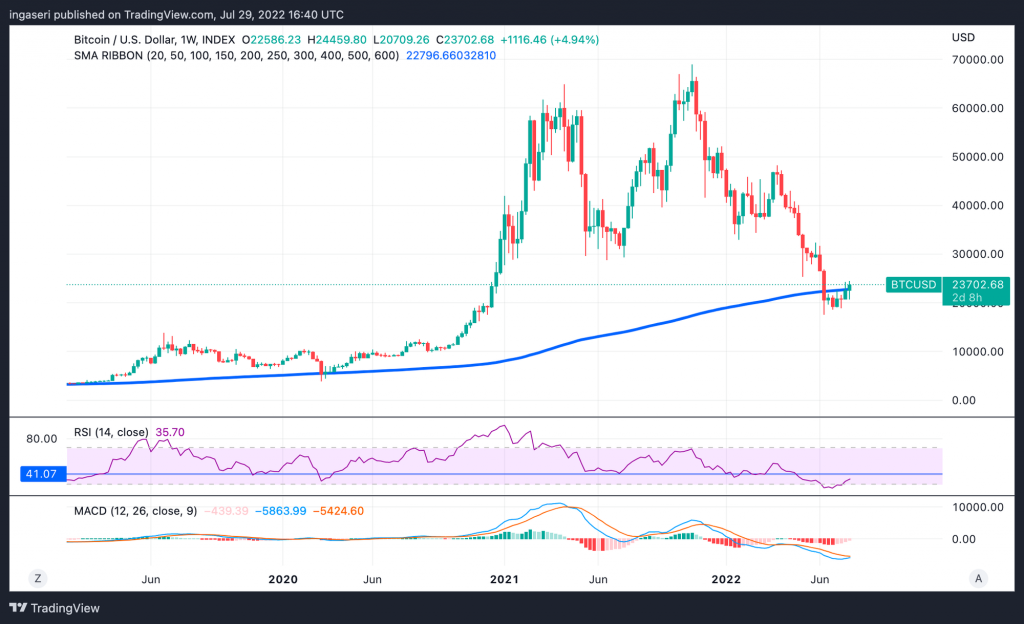
We see BTC’s price went up after the Fed rate hike was announced. Selling pressure decreased, but investors were still under pressure from recession fears. In the market, there was a 75 percent possibility of 75 basis points and a 25 percent probability of 100 basis points. The new outcome is still net QT, so even if the more optimistic option was chosen, it will take some time for its effects to spread throughout the market.
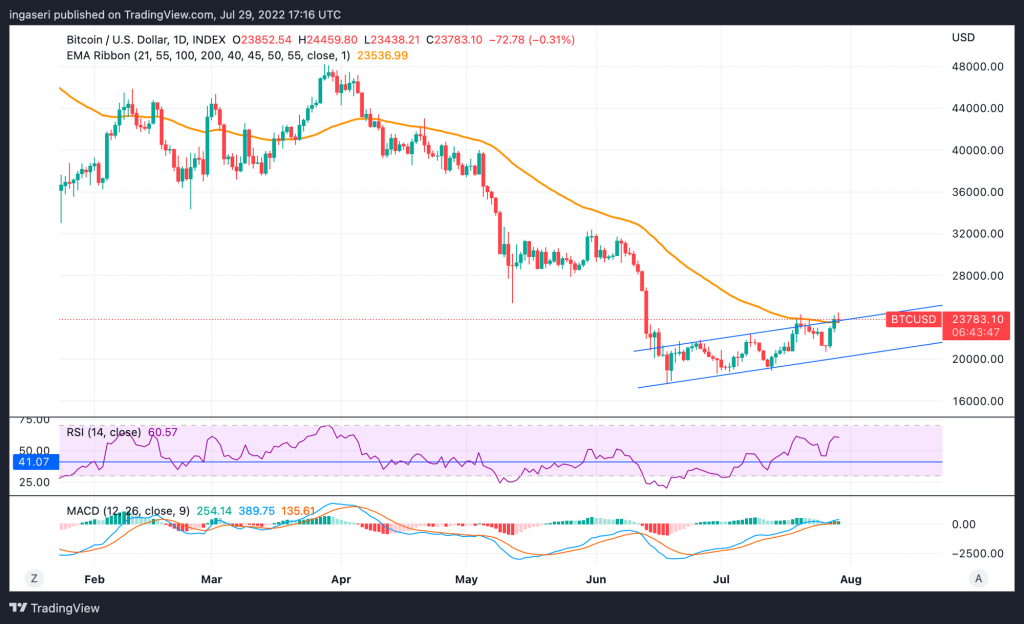
Notably, the price of BTC has managed to cross above the 200 MA line, a historically reliable support line, for the first time since a month ago. This line has been a reliable predictor of the bottom for BTC. We need to find support at this line and continue its upside momentum.
Notice also that BTC went above the 55 weeks EMA resistance line. This might be a fake-out, and we need to see BTC finding support on the newfound support line and continue its momentum to the upside. Notice that we are trying to break out of the rising channel to the upside. Until we have a confirmation of the breakout, expect the price of BTC to stay within the channel. In case of a bullish breakout, the 100-day moving average, which currently resides near the $28K level, would be the first obstacle before the significant $30K supply zone.
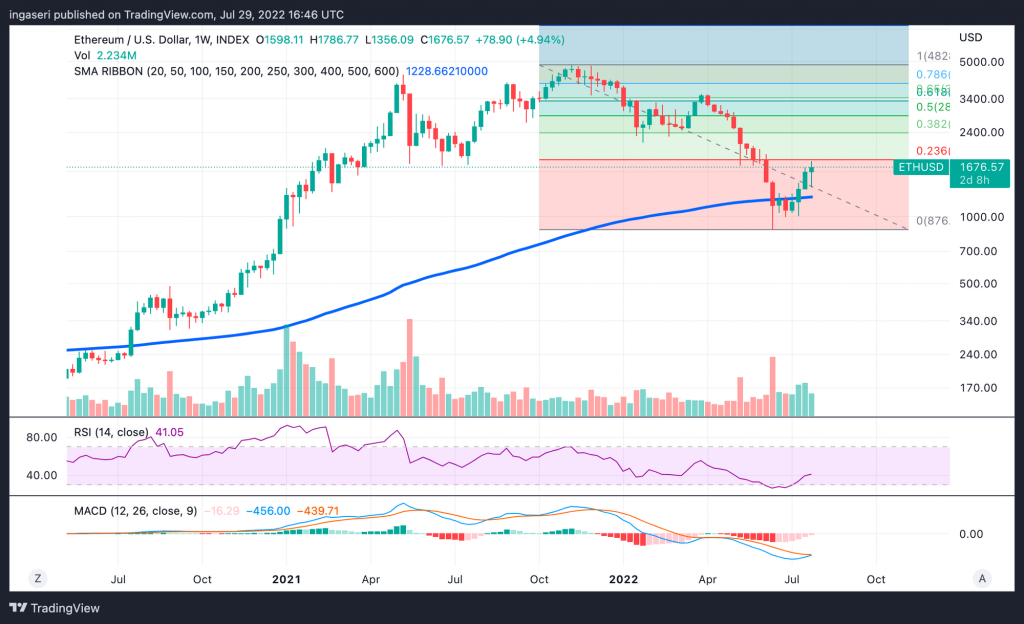
ETH has been very strong throughout the past 4 weeks. By the middle of the month, we had surpassed the 200-week MA. But take note of the fact that we are currently rejected at the 0.236 Fibonacci retracement line.
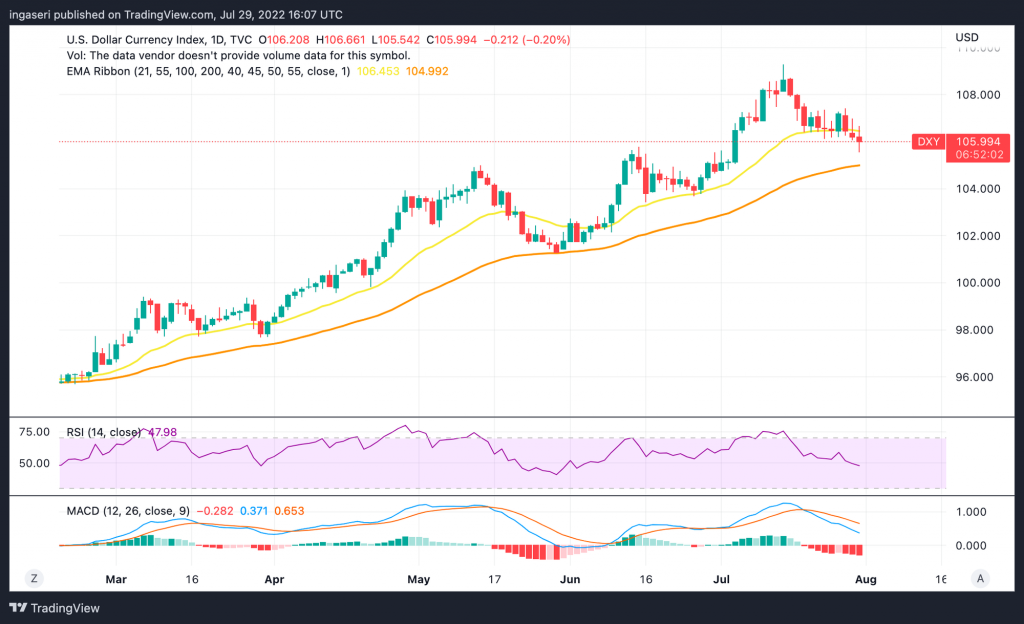
The DXY exerted less pressure on markets as certainty grew over this week’s FOMC meeting. Looking at the chart below, the last time we went below the 21 weeks EMA line was in mid-May. Notice that historically the 55 weeks EMA has been a good support line.
Looking at the option interest of put to call ratio, it has continued its downtrend throughout July. This means that the protection to the downside has reduced, the market is gaining confidence about the price of BTC.
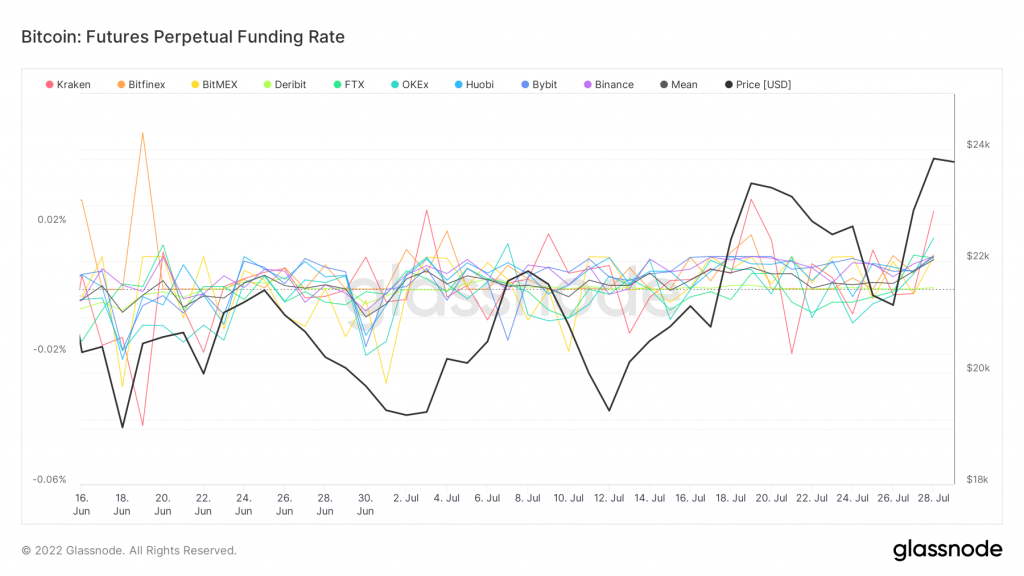
As the price of BTC has increased over the past month. We can see that the perpetual funding rate also increased. This means the market sentiment for Bitcoin has turned positive as compared to the previous month. We have to in turn be cautious of the dead cat bounce.
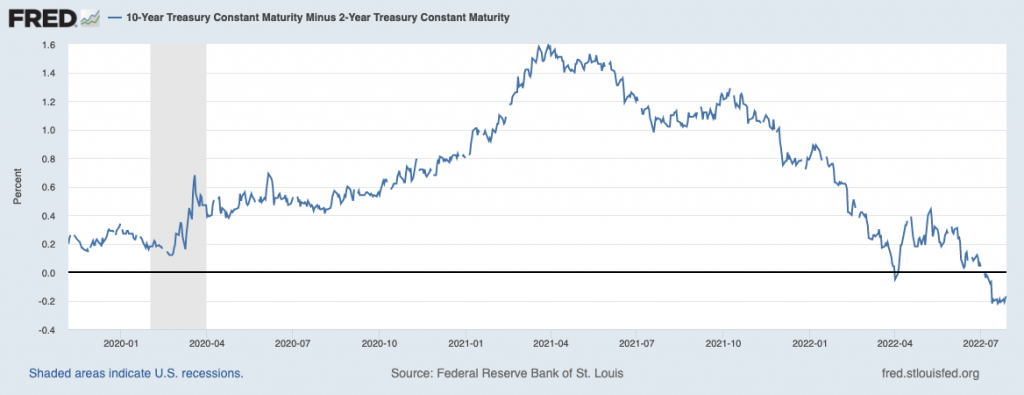
10Y Treasury yield is still below that of 2Y. This indicates the growing uncertainty across market as the economy is facing quantitative tightening.
On-chain Analysis
- 📊 Exchange: As the exchange reserve continues to fall, it indicates lower selling pressure. However, net deposits on exchanges are high compared to the 7-day average. Higher deposits can be interpreted as higher selling pressure.
- ⛏ Miner: Miners’ are selling holdings in a moderate range compared to its one-year average. Miner’s revenue is in a moderate range, compared to its one-year average.
- 🔗 On-chain: Investors are in a fear phase where they are currently with unrealized profits that are slightly more than losses. The total number of active wallets used to send and receive coins has decreased WoW. The total number of transactions has decreased WoW as well.
- 🏦 Derivatives: Long position traders are dominant and are willing to pay to short traders. Buying sentiment is dominant in the derivatives market. More buy orders are filled by takers. As OI increases, it indicates more liquidity, volatility, and attention are coming into the derivative market. The increasing trend in OI could support the current ongoing price trend.
Altcoins News
- 🔗 Input Output (IOG), the development lab for Cardano, said the Vasil hard fork that was previously planned for release in June, will be delayed by a few more weeks. Kevin Hammond, IOG’s technical manager, said testing for “inevitable issues” was ongoing and being fixed by the development team. Vasil is an upgrade designed to increase Cardano’s scalability.
More News from Crypto Sector Last Week
- 💸 Babel Finance, a crypto lender from Hong Kong that suspended withdrawals last month reported losses of US$280 million in exclusive trading with customer funds, The Block reported. Babylon lost around 8,000 bitcoin (BTC) and 56,000 ether in June in forced liquidation as the crypto market plunged to an 18-month low, with the value of Bitcoin dropping below $20,000.
- 📈 OpenSea has posted small month-over-month gains in total NFT sold and unique users. However, the overall USD sales volume has declined. Data shows that NFT trading across the Solana market has cooled so far in July compared to June.
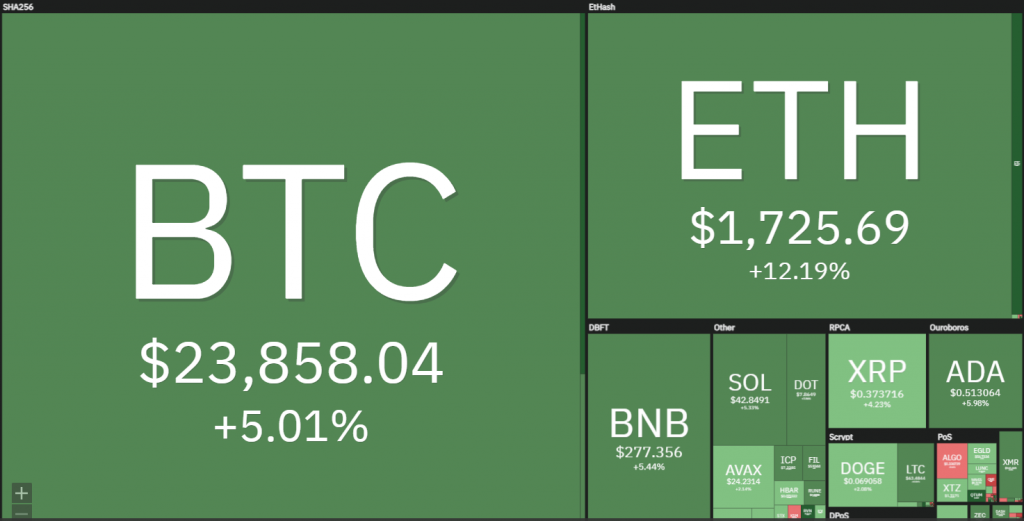
Cryptocurrency Performance Over The Past Week
References
- Andrew Hayward, Ethereum NFT Sales Hold Steady in July as Trading Volume Sinks Further, Decrypt, accessed on Aug 1, 2022
- Shaurya Malwa, Cardano’s Vasil Upgrade Is Delayed Again for More Testing, CoinDesk, accessed on Aug 1, 2022
- Lender Babel Finance Lost $280M Trading Customer Funds: Report, CoinDesk, accessed on Aug 1, 2022
- Andrew Throuvalas, Bitcoin Bear Market Claims Another Crypto Firm as Zipmex Files for Protection From Bankruptcy, Decrypt, accessed on Aug 1, 2022
Share
Related Article
See Assets in This Article
BTC Price (24 Hours)
Market Capitalization
-
Global Volume (24 Hours)
-
Circulating Supply
-


