Market Analysis June 12-18: Fed Raises Interest Rates, BTC Market Cap Drops & ETH Breaks Support

The crypto market in recent months has been in a bearish trend. Through Market Analysis compiled by Pintu’s trading team, you can learn about Bitcoin and other crypto-assets fluctuations, as well as find out about the latest updates in the industry. Read the full analysis here.
Market Analysis Summary
- 📈 The US Federal Reserve on Wednesday raised its benchmark interest rate by 75 basis points.
- 💥 BTC’s market cap is down to $355 billion, and its dominance has been reduced to just over 44%.
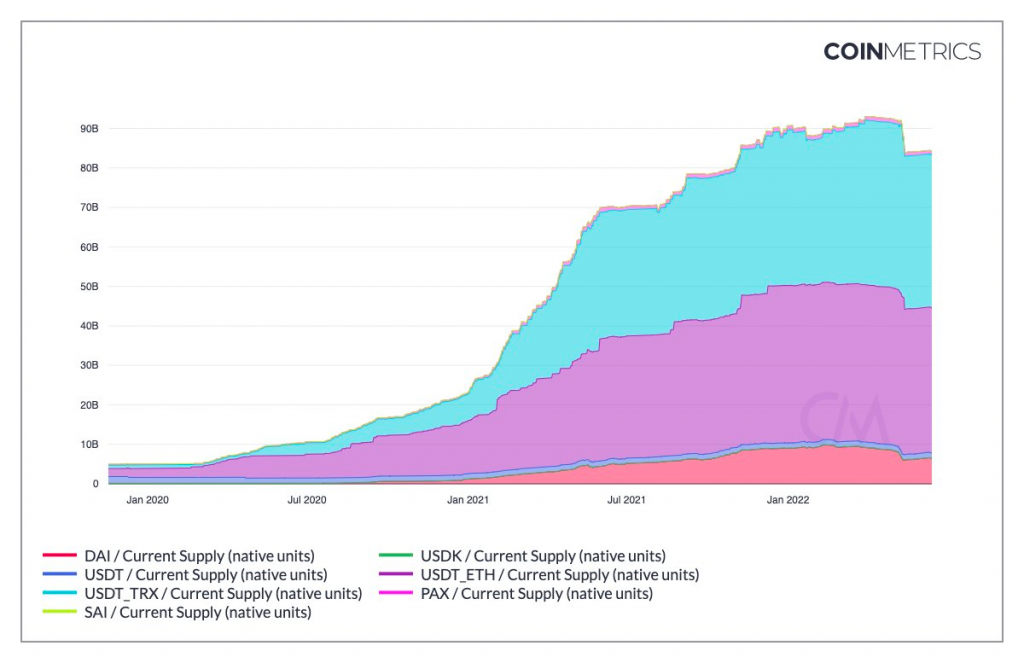
- 📉 For the first time ever, the total stablecoin supply decreased by over a quarter for the first time in history.
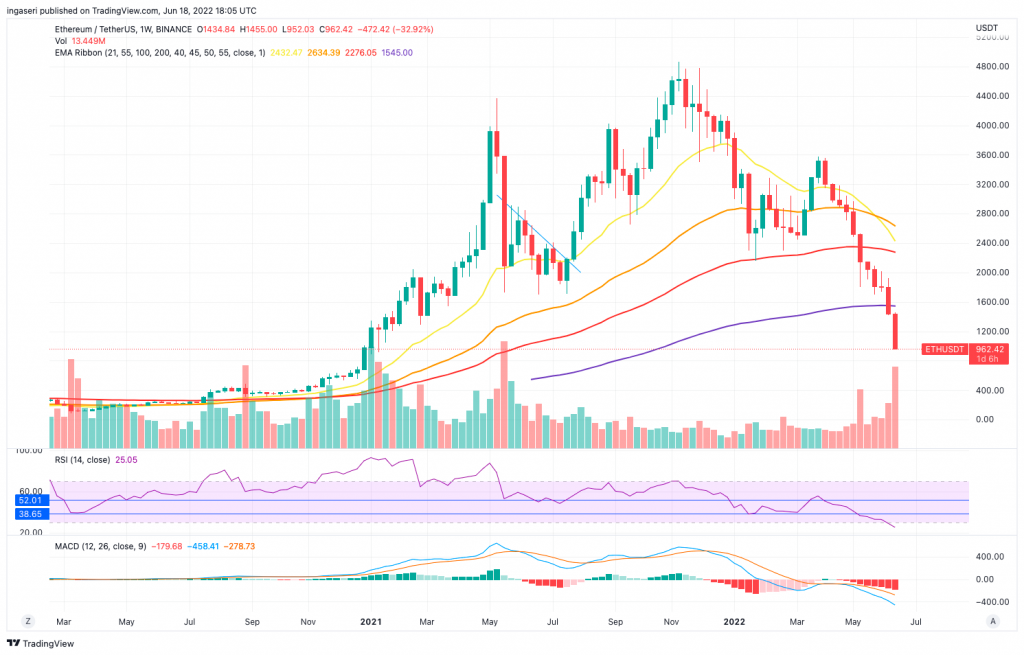
- ⚠ ETH loses its 200-week support as well over the week.
The US Federal Reserve on Wednesday raised its benchmark interest rate by 75 basis points. This marks its biggest rate hike in 28 years. The Federal Open Market Committee (FOMC) said in a statement that it decided to raise the target range for the federal funds rate to 1.5%-1.75% range. This shows the aggressive stance of the US Central Bank to tame inflation, which is currently running at 8.6 percent.
BTC was already reacting to the released CPI data early last week, by falling into the 23k price. The situation took another turn for the worse in the next few days and BTC found itself struggling to remain above 20k for most of the week when the news of 3AC and Celsius halting withdrawals are out.
💡 US inflation hit a 40-year high as May’s CPI stood at 8.6%, up from 8.3% in April and above the consensus level of 8.3%.
Meanwhile, major investment firm Three Arrows Capital (3AC) is rumored to be going bankrupt, and the leading DeFi platform that facilitates lending and borrowing, Celsius, has frozen withdrawals. These factors led to a fairly sharp decline in the price of BTC in the past week.
Both the stock and crypto market reacted positively a day after the Fed announcement of the Fed rate hike by 75 bps. A day after that, BTC decreased and tumbled. Over the week, BTC took a ~29% dive, while ETH took a -31% hit at the time of writing this.
BTC’s market cap is down to $355 billion, and its dominance has been reduced to just over 44%.
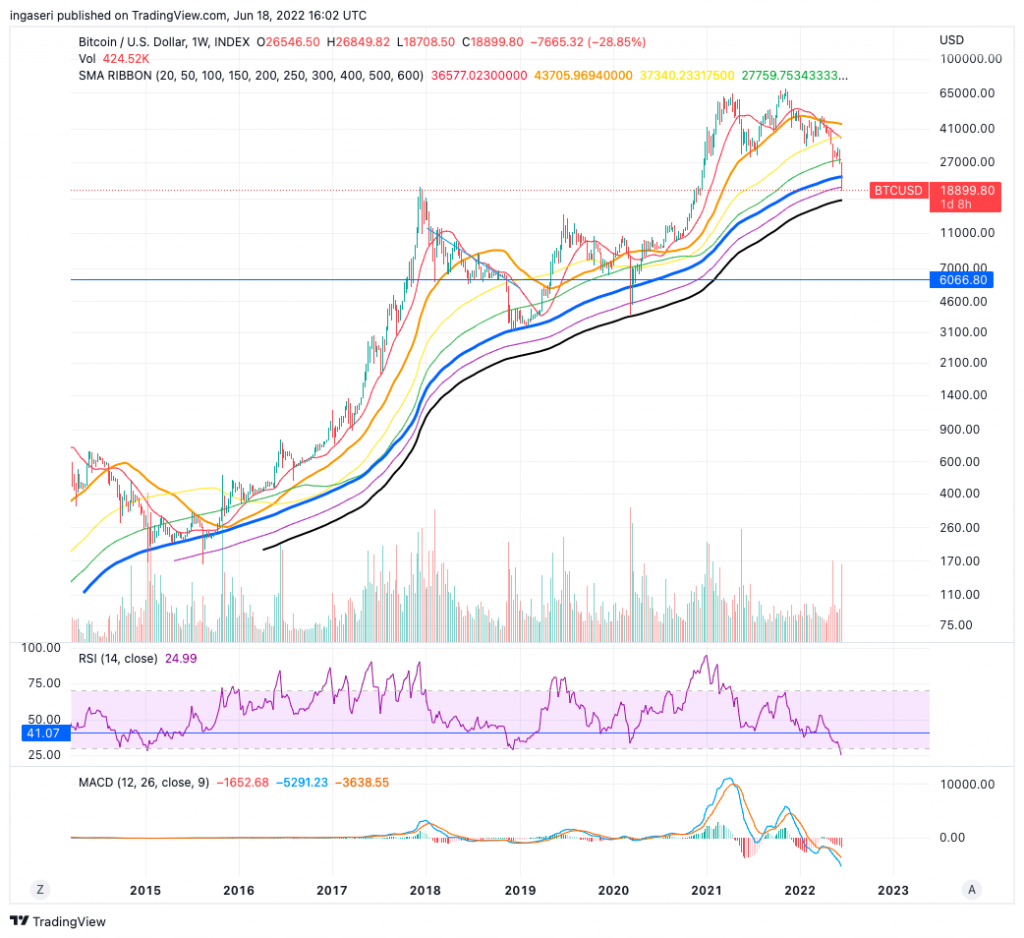
BTC broke the historically strong support of 200 weeks MA. Looking at the chart below, we can see on 3 previous occasions, BTC has held up to its 200 weeks MA, with 2 occasions where it wicks down till the 250 (August 2015) and 300 weeks MA (March 2020). Currently, we are supported by the 250 weeks MA. The next support would be on the 300 weeks MA, which is at the price point of 16.5k.
Note that BTC tends to wick from -14% to -28% below the 200-MA, historically. Currently, BTC is -15% below the 200-MA. If we were to repeat the March 2020 downside wicking depth below the 200-MA, we can expect BTC to revisit the 15.5K price point.
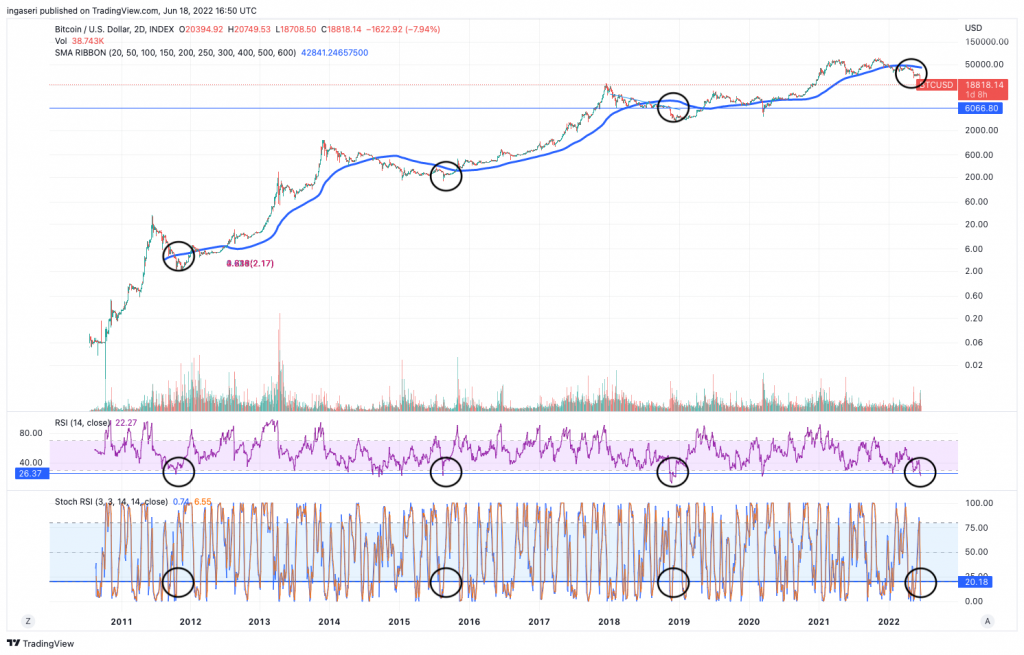
Other interesting signals/criteria to watch for the BTC cycle bottom are:
- BTC price is below the 200 2-days charts.
- BTC RSI has to be below 25.
- Stochastic RSI has to be below 20.
Throughout the history of BTC, we can see there are only 3 occasions that both 3 criteria listed above have been fulfilled, and every time it got fulfilled, it became a strong signal that BTC has bottomed. We have just fulfilled these 3 criteria.
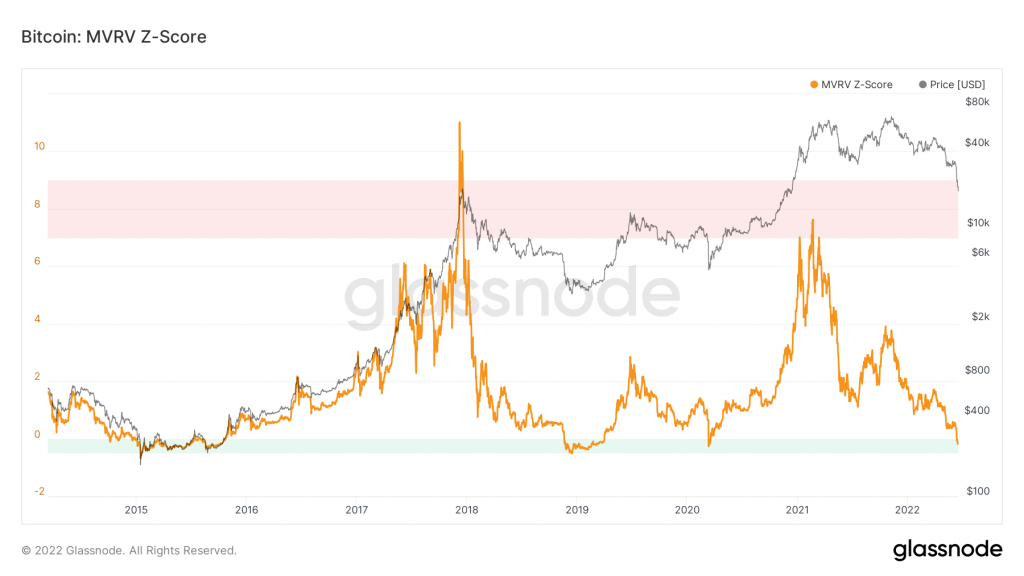
Looking at the MVRV-Z Score, BTC price finally sits below its realized price, this means that BTC is undervalued relative to its “fair value”.
When market value is significantly higher than realized value, it has historically indicated a market top (red zone), while the opposite has indicated market bottoms (green zone). Technically, MVRV Z-Score is defined as the ratio between the difference of market cap and realized cap, and the standard deviation of all historical market cap data, i.e. (market cap – realized cap) / std(market cap).
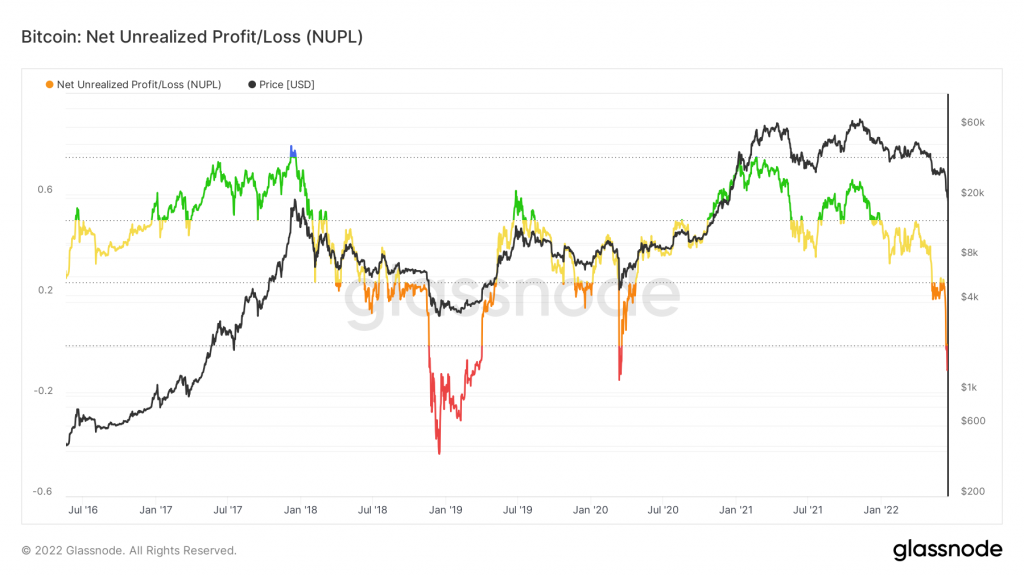
The BTC’s NUPL has also finally reached a level that is considered capitulation. Net Unrealized Profit/Loss (NUPL) is the difference between Relative Unrealized Profit and Relative Unrealized Loss.
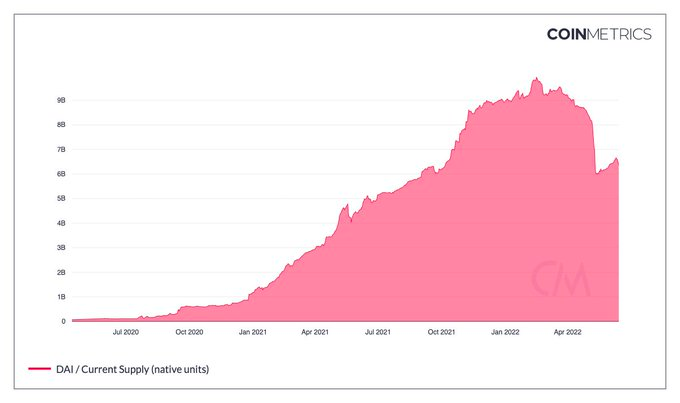
For all we know, Bitcoin has never went through a recession before. Should US enters a recession, it will be interesting to see how Bitcoin Perform for the first time in a recession. Furthermore, the crypto market rout is further exacerbated by the fall of UST. For the first time ever, The total stablecoin supply decreased over quarter for the first time in history. Stablecoin redemptions have reached a historic high, with more than $10 billion redeemed across major issuers and about $3 billion retired from MakerDAO, as a result of liquidations, the largest liquidation event of its history, which accounts for almost 40% of MakerDAO’s DAI.
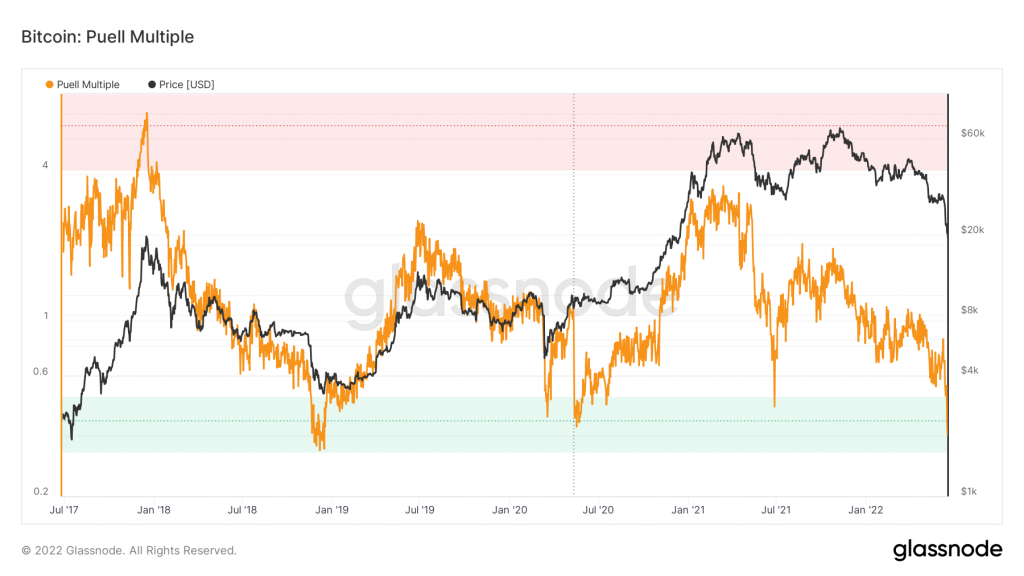
The Puell multiple is a long-term cyclical oscillator that captures the overall behavior of the mining market. it takes into account the profitability in the overall dynamics of what is going on with the Bitcoin compulsory sell-side (miners). High profitability creates incentives to sell (red zone) and poor profitability suggests miners’ capitulation (green zone). We are currently in the green zone.
ETH loses its 200 week support as well over the week, breaking down the historically strong support. In the bearish scenario, if the sellers push the price below, the potential demand zone can be considered in the range of $700-$900. If this area is touched, ETH might enter the accumulation phase after. Support levels are at $1,000 and $900, while resistance level is at $1,300.
On-chain Analysis
- 📉 All Exchanges’ reserves remain at over a 3-year low. Spot Exchanges’ reserve is remaining the same level. Derivatives Exchanges’ reserve has significantly increased. 3iQ BTC ETF holding decreased while Purpose ETF holding increased. In a weekly time frame, Technical Oscillators seems negative.
- 🐳 Whales and miners are distributing. Miners are sending BTC to exchanges as they did on Q1 2021. The number of BTC being transferred to Derivatives Exchanges is increasing.
- ⚠ Negative market sentiments are stronger among the futures investors. Open interest dropped significantly, but it’s still more than twice the size at the same market price in 2020. The estimated leverage ratio value is still relatively high. US investors (possibly institutions) are selling BTC despite the negative premium.
- 💸 Both short-term and long-term holders are selling at a loss. On-chain indicators signal that the BTC is undervalued.
About Altcoins
- 👀 Tron’s UST-like stablecoin traded at under 97 cents last week. Citing The Block, on Monday, Tron DAO Reserve deployed $2 billion to counter the sell-off. On Tuesday, they added another 500 million. On Wednesday, Tron DAO Reserve withdrew $125 million worth of TRX from Binance. This raises concerns in the market which has not recovered since the TerraUSD (UST) incident last month.
Other News About Crypto
- 🌖 Do Kwon, Terraform Labs, hit by class-action lawsuit. The lawsuit filed on Friday accuses Do Kwon, Terraform Labs (TFL), and others of selling unlisted securities and making false statements about the stability of the TerraUSD (UST) stablecoin and LUNA tokens to encourage investors to buy them. The lawsuit argues that while the Terra token has all the hallmarks of an investment contract, “no registration statement was filed with the SEC (United States Securities and Exchange Commission).”
- 🔗 Solend approves the takeover of “whale” wallets to avoid DeFi catastrophe. On Sunday, Solend, Solana’s popular DeFi protocol , drafted a sudden governance proposal in relation to one of the “whale” wallets at risk of liquidation. The proposal, dubbed “SLND1: Risk Mitigation From the Pope,” was suddenly launched on Sunday without announcement and the vote closed with a 97% approval rating. The scandal comes after last week’s sudden layoffs from Coinbase and BlockFi, and the disastrous liquidation of Three Arrows Capital. The sudden shift from a supposedly decentralized autonomous organization, or DAO, shows that crypto is not as “decentralized” as its users might think.
- 🌡 Three Arrow Capitals and a drop in Celsius prompted a sell-off in DeFi. Quoting Coin Telegraph, the decentralized financial ecosystem is facing the heaviest burden triggered by rumors of the liquidation of Three Arrow Capital (3AC) and Celsius. MakerDAO decided to remove Aave from its direct deposit module as a safeguard against the possibility that Celsius would close and then drop the price of Ether at stake (stETH). Meanwhile, 8 Blocks Capital called on platforms holding 3AC-owned funds to freeze their assets due to rumors of 3AC bankruptcy.
Reference
- Eddie van der Walt, There’s Something Different About This Bitcoin Drawdown, Bloomberg, accessed on June 19, 2022
- Mike Millard, Do Kwon, Terraform Labs, others hit with class action lawsuit, The Block, accessed on June 19, 2022
- Lucy Harley-Mckeown, Tron deploys $2 billion from reserves to guard against shorts, The Block, accessed on June 19, 2022
- Ezra Reguerra, USDD stablecoin falls to $0.97, DAO inserts $700M to defend the peg, Cointelegraph, accessed on June 19, 2022
- Prashant Jha, Finance Redefined: Three Arrow Capital and Celsius fall brings a tsunami of sell-off in DeFi, Coin Telegraph, accessed on June 20, 2022
- Sean Moore, What decentralization? Solana lender Solend approves whale wallet takeover to avoid DeFi implosion, Cointelegraph, accessed on June 20, 2022
Share
Related Article
See Assets in This Article
AAVE Price (24 Hours)
Market Capitalization
-
Global Volume (24 Hours)
-
Circulating Supply
-


