Market Analysis Dec 2nd, 2024: ETH ETF Surpass BTC ETF. Is Alt Season here?

Bitcoin has yet to break the $100,000 price but still managed to close November with a substantial 38% gain at $97,461. Meanwhile, the inflow of US-based Ether Spot ETFs hit a new record on November 29th. The market believes that altcoin season has begun with the rise in prices of “senior” tokens like XRP, ADA, and others. Positive macroeconomic indicators further bolster the potential for continued growth within the broader crypto market. Check out the macro and crypto analysis by the Pintu trader team below.
Market Analysis Summary
- 💪🏻 The $100,000 mark represents a critical psychological barrier. Successfully surpassing this milestone could signal a significant breakthrough in BTC’s ongoing rally.
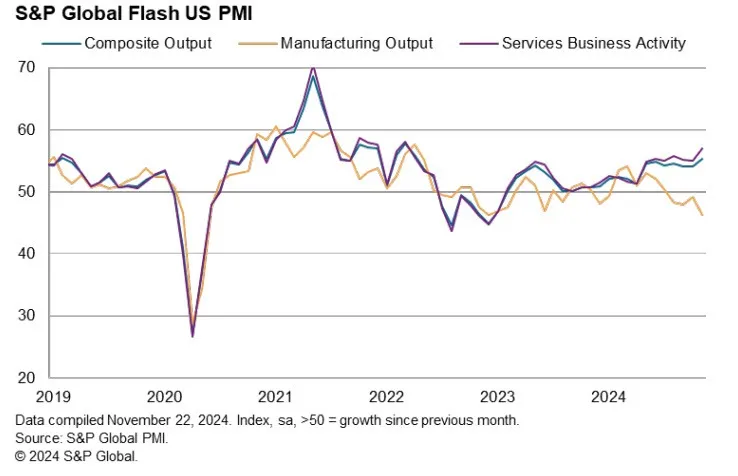
- 🚀 S&P global flash manufacturing index 48.8 vs 48.8 estimate vs 48.5 Prior month. S&P global flash services index 57.0 vs 55.2 estimate vs 55.0 prior month. Best since March 2022.
- 📈 The Michigan Consumer Sentiment Index increased to 71.8 for its final November reading, better than the survey’s October results, but below the preliminary reading taken before the presidential election.
- 🟢 New orders for manufactured durable goods rose by $0.7 billion in October. The U.S. goods trade deficit narrowed in October to $99.1 billion.
Macroeconomic Analysis
S&P Global PMI
The US S&P Global Composite PMI climbed to 55.3 in November’s flash estimate, up from 54.1 in October, indicating an accelerating expansion in private sector business activity.
The S&P Global Manufacturing PMI edged up slightly to 48.8 from 48.5, reflecting a continued contraction in manufacturing, while the Services PMI increased to 57 from 55, signaling stronger growth in the services sector.

Business sentiment has improved notably in November, with confidence for the year ahead reaching its highest level in 2.5 years. Expectations of lower interest rates and a more pro-business stance from the incoming administration have boosted optimism, driving higher output and increased order book inflows during the month.
Other Economic Indicators
- Michigan Consumer Sentiment: Consumer sentiment continued to improve in November, according to the University of Michigan’s final Consumer Sentiment Index report. The index rose by 1.3 points (1.3%) from October’s final reading to 71.8, though it fell short of the forecasted 73.0. Overall, consumers anticipate moderate economic improvement over the next six months. However, shifts in sentiment varied based on political affiliation and individual views on the election outcome.
- New Home Sales: Sales of new single-family homes in October 2024 were recorded at a seasonally adjusted annual rate of 610,000, according to a joint release from the U.S. Census Bureau and the Department of Housing and Urban Development. This represents a 17.3% decrease (±12.8%) from the revised September rate of 738,000 and a 9.4% decline (±19.0%)* compared to the October 2023 estimate of 673,000.
- Durable Goods Orders: The U.S. Census Bureau reported today that new orders for manufactured durable goods rose in October, ending a two-month decline. Orders increased by $0.7 billion, or 0.2%, to reach $286.6 billion, following a 0.4% drop in September. When excluding transportation, new orders rose by 0.1%, and when excluding defense, they increased by 0.4%
- Goods Trade Balance: The U.S. goods trade deficit narrowed in October to $99.1 billion, down from $109 billion in September, according to the Bureau of Economic Analysis. Exports dropped by $5.6 billion month-over-month to $168.7 billion, while imports fell by $15.2 billion to $267.8 billion. Wholesale inventories rose to $905.1 billion in October, marking a 0.2% increase from the previous month and a 0.9% rise compared to October 2023.
- GDP: The Commerce Department’s Bureau of Economic Analysis reported that gross domestic product (GDP) grew at an annualized rate of 2.8%, unchanged from its initial estimate. The economy expanded at a 3.0% annualized rate in the April-June quarter, surpassing the Federal Reserve’s estimated non-inflationary growth rate of approximately 1.8%.
- Jobless Claim: The Labor Department reported on Wednesday that initial claims for state unemployment benefits fell by 2,000 to a seasonally adjusted 213,000 for the week ending November 23. Economists had predicted 216,000 unemployment claims for the latest week. Claims have declined from the nearly 1.5-year high recorded in early October.
BTC Price Analysis
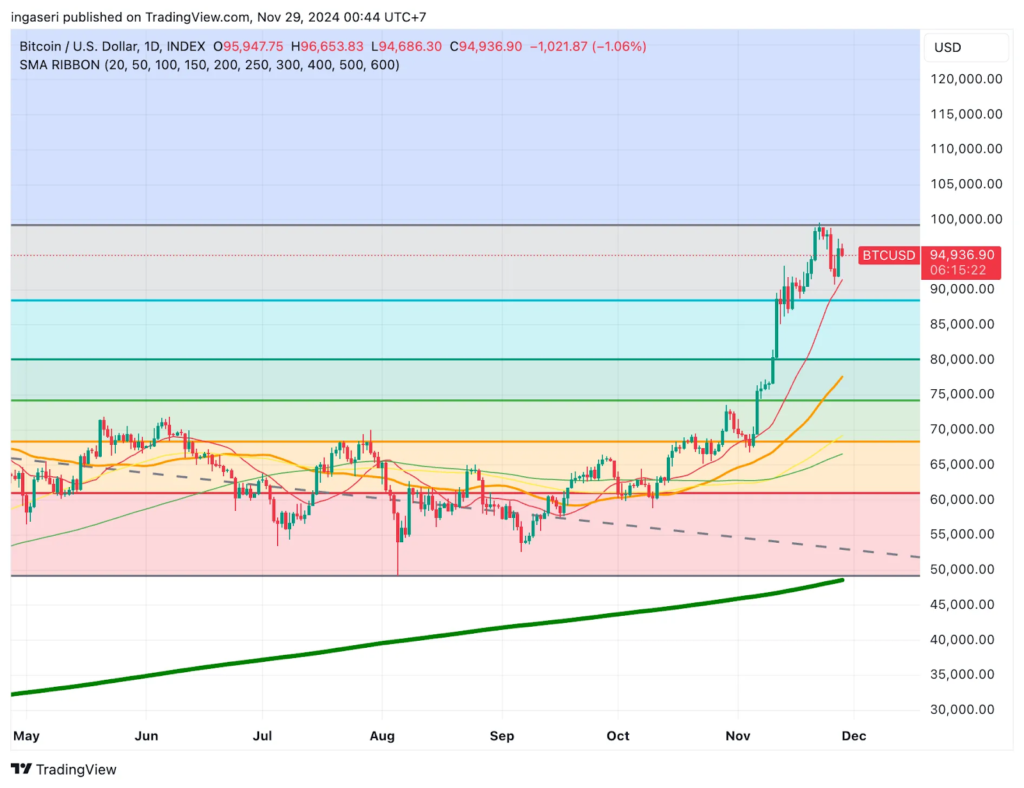
Despite its upward momentum, BTC is encountering significant resistance as it nears the $100,000 mark. On November 28, BTC approached $97,000 but faced intense selling pressure just below this critical level.
The Relative Strength Index (RSI), currently at 65.02, suggests that BTC is neither overbought nor oversold, leaving room for potential upward movement if positive sentiment persists. However, the MACD indicates mild bearish momentum, with the histogram nearing a crossover below the signal line. This could point to a possible slowdown or reversal in the uptrend unless buying pressure intensifies to break through the resistance near the $100,000 level.
The $100,000 mark represents a critical psychological barrier. Successfully surpassing this milestone could signal a significant breakthrough in BTC’s ongoing rally.

On-Chain Analysis
- 📊 Exchange: As the exchange reserve continues to fall, it indicates lower selling pressure. Net deposits on exchanges are high compared to the 7-day average. Higher deposits can be interpreted as higher selling pressure.
- 💻 Miners: Miners’ are selling more holdings compared to its one-year average. Miner’s revenue is in a moderate range, compared to its one-year average.
- ⛓️ On-chain: More investors are selling at a profit. In the middle of a bull market, it can indicate a market top. Long term holders’ movement in the last 7 days was higher than the average. If they were moved for the purpose of selling, it may have negative impact. Investors are in a belief phase where they are currently in a state of high unrealized profits.
- 🏦 Derivative: Long position traders are dominant and are willing to pay to short traders. Buying sentiment is dominant in the derivatives market. More buy orders are filled by takers. As open interest increases, it indicates more liquidity, volatility, and attention are coming into the derivative market. The increasing trend in open interest could support the current ongoing price trend.
- 🔀 Technicals: RSI indicates a neutral condition. Stochastic indicates a overbought condition where the current price is close to its high in the last 2 weeks and a trend reversal can occur.
News About Altcoins
- Cryptonary Media Analysis: WIF Token Could Soar 56x. DogWifHat (WIF) has experienced explosive growth since December 2023, skyrocketing over 85,000%. Experts predict that WIF could mirror DOGE’s success, potentially surging 56x to a target price of $100 per coin. Its simple meme concept—a dog with a hat—has captivated retail investors, while the robust Solana ecosystem provides a strong foundation. Although the memecoin market is inherently volatile, WIF’s organic growth, large holder base, and positive social sentiment make it a promising contender in the current memecoin cycle.
News from the Crypto World in the Past Week
- Ether ETFs Hit New High: BlackRock Leads the Charge. Spot Ether ETFs in the United States shattered their daily inflow record on November 29th, attracting $332.9 million, surpassing the previous high of $295.5 million set on November 11th. BlackRock’s iShares Ethereum Trust (ETHA) was the primary driver, garnering $250.4 million, bringing its total inflows to over $2 billion since its July launch. Notably, Ether ETF inflows exceeded Bitcoin’s for the first time on that same day, indicating a growing Wall Street appetite for altcoin rotation. Despite recent Bitcoin ETF outflows, Ether ETFs continue to exhibit a positive trend.
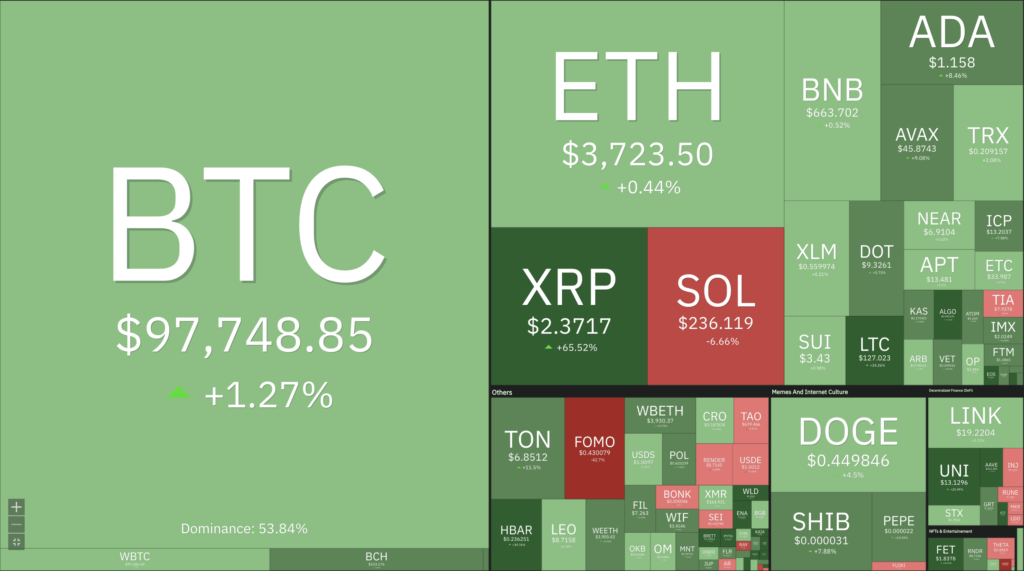
Cryptocurrencies Market Price Over the Past Week

Cryptocurrencies With the Best Performance
- Ethereum Name Service (ENS) +106.44%
- Algorand +82.48%
- XRP +73.22%
- Hedera (HBAR) +69.04%
Cryptocurrencies With the Worst Performance
- Raydium (RAY) -12.27%
- The Sandbox -9.43%
- Popcat (POPCAT) -6.98%
- Solana -4.53%
References
- Ciaran Lyons, Spot ETH ETFs clocks highest daily inflow day: ‘Alt rotation has begun’, cointelegraph, accessed on 1 Desember 2024.
- Cryptonary, A thesis on how DogWifHat (WIF) gets to $100, accessed on 1 Desember 2024.
Share
Related Article
See Assets in This Article
6.0%
0.0%
6.5%
0.0%
0.0%
BTC Price (24 Hours)
Market Capitalization
-
Global Volume (24 Hours)
-
Circulating Supply
-


