Market Analysis Feb 17th, 2025: $95K Holds as BTC Support, While BNB Network Takes the Spotlight

Bitcoin has been moving sideways over the past week. However, the market was surprised by the launch of a Memecoin from the Central African Republic, introduced by Central African Republic President Faustin-Archange Touadéra, as well as a trending Memecoin on the BNB network. Meanwhile, investors are still waiting to see where BTC is headed next. Read the full analysis by the Pintu Trader Team.
Market Analysis Summary
- 📝 BTC remains at a critical juncture, with $95,415 acting as key support and $98,000 as immediate resistance. A bearish breakdown could push BTC toward $91,500, while a bullish breakout above $100,010 – $102,736 could shift momentum in favor of buyers.
- 📈 Nonfarm payrolls rose by 143,000 in January.
- 🔻 The unemployment rate stands at 4.0%, the lowest since May.
- 💼 Average hourly earnings surged 0.5% for the month, marking a 4.1% annual increase.
- 📉 Consumer sentiment falls to a seven-month low as inflation expectations climb.
- 🆘 Trump’s proposed tariffs add to inflation concerns, further weighing on sentiment.
Macroeconomic Analysis
U.S. Job Growth Slows in January, but Strong Wage Gains May Delay Fed Rate Cuts
U.S. job growth slowed more than expected in January after strong gains in the previous two months. However, the unemployment rate held at 4.0%, likely giving the Fed reason to delay interest rate cuts until at least June.
The Labor Department’s closely watched employment report released Friday also revealed robust wage growth, with average hourly earnings rising at the fastest pace in five months. This strength in wages is expected to support consumer spending, reinforcing labor market resilience as a key driver of economic expansion.
Concerns are growing that President Trump’s push for tighter immigration policies and broad tariffs on imports could significantly impact both the labor market and the broader economy in the coming months. While a planned 25% tariff on Canadian and Mexican goods has been postponed until next month, the ongoing uncertainty may deter business expansion, potentially slowing job creation.
Other Economic Indicators
- Employment Trends and Sector Highlights: In January, nonfarm payrolls increased by 143,000, following a sharply revised gain of 307,000 in December—the highest in nearly two years. Job growth had surged by 261,000 in November. Economists had expected an addition of 170,000 jobs, with forecasts ranging from 60,000 to 250,000.
- Market Reaction and Fed Outlook: The labor market’s continued strength allows the Fed to hold off on rate cuts while policymakers evaluate the impact of Trump administration policies, including tax cuts, which some economists view as inflationary. Following the jobs report, U.S. Treasury yields climbed, stock markets declined, and the dollar strengthened against a basket of currencies.
- Fed Holds Rates Steady as Markets Eye a June Cut: The Fed kept its benchmark overnight interest rate unchanged at 4.25%-4.50% last month, maintaining its stance after reducing rates by 100 basis points since September, when it began its policy easing cycle. This follows a total rate hike of 5.25 percentage points in 2022 and 2023 aimed at curbing inflation. Financial markets are now anticipating a rate cut in June.
- Final Jobs Report Under Biden’s Administration Shows Downward Revision: The final employment report under former President Joe Biden’s administration revealed that 598,000 fewer jobs were created in the 12 months through last March than previously estimated. However, the final payrolls benchmark revision was smaller than the Bureau of Labor Statistics’ (BLS) August estimate of an 818,000-job reduction. Despite the downward revision, the labor market remains strong. Average hourly earnings rose by 0.5% in January, the largest increase since August, following a 0.3% gain in December.
- Unemployment Rate at 4.0%, Revised Population Controls Impact Data: The household survey showed that the unemployment rate fell to 4.0%, the lowest since May. However, this figure is not directly comparable to December’s 4.1% due to new population controls that apply only to January and future reports, creating a break in the data series. The updated population weights added 0.1 percentage point to the jobless rate, but without these adjustments, the unemployment rate would have declined by 0.2 percentage points.
- Michigan Consumer Sentiment: According to the University of Michigan Surveys of Consumers released on Friday, the Consumer Sentiment Index fell to 67.8, down from January’s final reading of 71.1, which had aligned with economists’ expectations in a Reuters poll.
- Inflation Rate: Consumer prices rose 0.5% in January, the fastest pace since September 2023, pushing the annual inflation rate to 3% for the 12 months ending in January, according to the latest Consumer Price Index (CPI) data released Wednesday by the Bureau of Labor Statistics. Economists had expected a moderate increase with little change from December’s figures.
- Price Increases Across the Board, Led by Energy and Food: The CPI tracks price changes across commonly purchased goods and services, and most categories saw increases in January. Energy and food costs continued to rise, with egg prices soaring 15.2% from December to January—the fastest monthly increase since 2015—as a deadly avian flu outbreak disrupted supply. Year-over-year, egg prices have surged 53%.
- Implications for the Federal Reserve and Trump’s Economic Policies: Although inflation has slowed significantly since hitting a 40-year high in 2022, prices are still rising faster than pre-pandemic levels, posing a challenge for the Trump administration. Additionally, inflation is moving in the opposite direction of the Federal Reserve’s 2% target, making it less likely the central bank will cut interest rates in the near future.
BTC Price Analysis
After dipping to the $91,350 support level, BTC attracted strong buyer interest, prompting a rebound that briefly pushed it back into the $100,000 zone. However, BTC was unable to break through this key threshold. Despite this, BTC has maintained its position above $95,000, signaling solid buying support.
As of this writing, BTC is just below a critical price zone that includes its annual VWAP, which aligns with its monthly pivot point at $100,335. While the short-term trend remains bearish, the medium- and long-term trends continue to be bullish, as indicated by the upward orientation and crossover of the 50-day and 200-day moving averages.
BTC’s bullish momentum has weakened but now appears to be stabilizing, potentially setting the stage for a rebound. This is evident in both its price action and key oscillators.
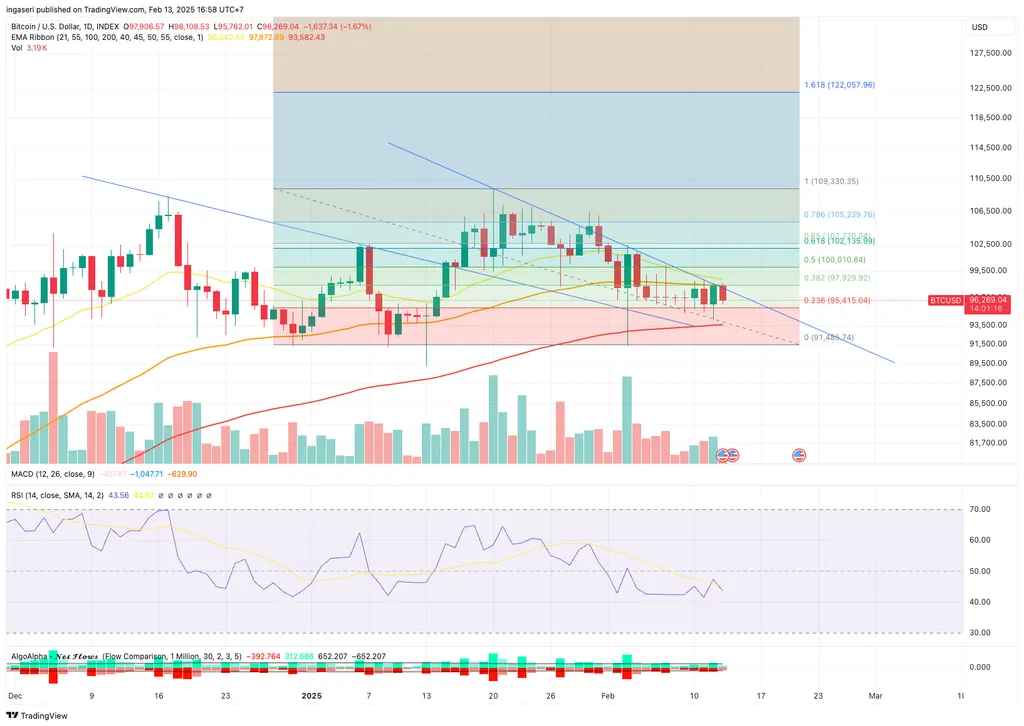
BTC is currently trading around $96,269, maintaining a downtrend within a descending channel. The price recently tested the $95,415 support level (Fib 0.236), which remains a crucial area to monitor. If BTC breaks below this level, it could retest the 200-day EMA at $93,582, and a further drop may lead to a decline toward the $91,485 support zone. Conversely, for a bullish reversal, Bitcoin needs to reclaim the $97,929 resistance (Fib 0.382), with a stronger breakout requiring a move above $100,010 (Fib 0.5 level).
The Fibonacci retracement levels indicate that BTC has been retracing from its recent high of $109,330. Key resistance levels include $100,010 (Fib 0.5) and $102,736 (Fib 0.618), both of which need to be reclaimed for a bullish trend shift. The EMA ribbon shows the short-term EMA (~$97,872) acting as resistance, while the 200-day EMA (~$93,582) provides long-term support. A sustained move above the $100,335 pivot point would be an early signal of trend recovery.
Momentum indicators suggest mixed signals. The MACD remains bearish, with the histogram still negative and the MACD line trading below the signal line. However, the RSI (Relative Strength Index) is at 43.56, showing weak momentum but not yet oversold. A move above 50 on the RSI would indicate improving buying strength. Additionally, volume has been declining, indicating reduced volatility and cautious market participation.
On the liquidity and flow side, net flows suggest a balanced market with limited liquidations on both the buy and sell sides. This indicates controlled volatility, but such equilibrium is unlikely to last, meaning a volatility spike could be imminent. If Bitcoin fails to hold above $95,000, selling pressure could increase, leading to a potential breakdown toward $92,000 – $91,500. However, if BTC manages to break $98,000, it could challenge the $100,000 – $105,000 range.
In summary, BTC remains at a critical juncture, with $95,415 acting as key support and $98,000 as immediate resistance. A bearish breakdown could push BTC toward $91,500, while a bullish breakout above $100,010 – $102,736 could shift momentum in favor of buyers. Traders should watch for increased volume and RSI movement above 50 as potential reversal signals.
On-Chain Analysis
- 📊 Exchange: As the exchange reserve continues to rise, it indicates higher selling pressure. Net deposits on exchanges are high compared to the 7-day average. Higher deposits can be interpreted as higher selling pressure.
- 💻 Miners: Miners’ are selling holdings in a moderate range compared to its one-year average. Miner’s revenue is in a moderate range, compared to its one-year average.
- ⛓️ On-chain: More investors are selling at a profit. In the middle of a bull market, it can indicate a market top. Long term holders’ movement in the last 7 days was lower than the average. They have a motive to hold their coins. Investors are in a belief phase where they are currently in a state of high unrealized profits.
- 🏦 Derivative: Long position traders are dominant and are willing to pay to short traders. Selling sentiment is dominant in the derivatives market. More sell orders are filled by takers. As open interest increases, it indicates more liquidity, volatility, and attention are coming into the derivative market. The increasing trend in open interest could support the current ongoing price trend.
- 🔀 Technicals: RSI indicates a neutral condition. Stochastic indicates a neutral condition where the current price is in a moderate location between the highest-lowest range of the last 2 weeks.
News About Altcoins
- Pump.fun Launches Mobile App for Solana Meme Coin Trading. Pump.fun, a Solana-based token launch platform, has released its mobile app on Android and iOS, enabling users to create tokens and trade meme coins without transaction fees. Leveraging Privy’s wallet infrastructure, the app allows users to sign in with an email or Google account, automatically generating a Solana wallet. Pump.fun recoups platform costs by charging a fee on each meme coin transaction. Despite low user ratings, the app has garnered approximately 50,000 downloads since its App Store debut in October. Within a year, Pump.fun has facilitated the launch of over 7 million tokens, generating nearly $500 million in revenue. However, the platform has also faced controversy, including speculation about a planned token launch of its own, restricted access in the UK, and a lawsuit alleging unregistered securities sales.
News from the Crypto World in the Past Week
- Institutions Increase Holdings of Bitcoin and Ethereum ETFs. Recent 13F filings show that Bitcoin ETFs remain the dominant cryptocurrency investment vehicle, while Ethereum ETFs have experienced a significant surge in institutional interest. BlackRock’s iShares Bitcoin Trust (IBIT) leads the market, with 1,100 institutions holding a combined 247 million shares. Goldman Sachs increased its IBIT holdings by 88%, bringing its total to 24.07 million shares. Notably, Abu Dhabi’s Sovereign Wealth Fund made its first foray into Bitcoin ETFs, purchasing $436.9 million worth of IBIT, signaling the entry of sovereign wealth funds into the asset class. Institutional ownership of Ethereum ETFs also saw substantial growth, jumping from 4.8% to 14.5%. Goldman Sachs has emerged as the largest holder of the iShares Ethereum Trust (ETHA), with 9.3 million shares valued at $195 million. This growing institutional participation, particularly from pension funds and other major financial institutions, underscores the increasing mainstream adoption of crypto assets.
Cryptocurrencies Market Price Over the Past Week
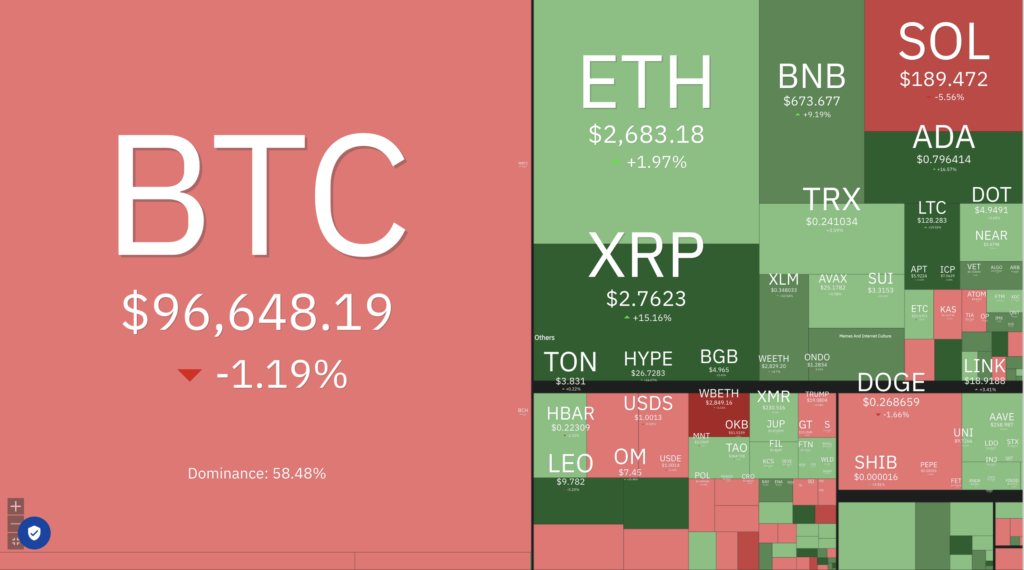
Cryptocurrencies With the Best Performance
- PancakeSwap +68.26%
- Sonic (S) +33.29%
- Kaspa (KAS) +31.18%
- Lido DAO +26.35%
Cryptocurrencies With the Worst Performance
- Solana -4.66%
- Ethena (ENA) -2.18%
- Ondo (ONDO) -1.66%
- Hedera -1.61%
References
- Logan Hitchcock, Pump.fun Debuts Mobile App for Launching and Trading Solana Meme Coins, decrypt, accessed on 15 February 2025.
- Jason Shubnell, Bitcoin ETFs maintain market lead as Ethereum ETFs see surge in institutional adoption, 13F filings show, theblock, accessed on 15 February 2025.
Share
Related Article


See Assets in This Article
BTC Price (24 Hours)
Market Capitalization
-
Global Volume (24 Hours)
-
Circulating Supply
-