Market Analysis January 7, 2023: US Labor Market and BTC is still in a Falling Wedge Pattern

Labor market rates in the United States have increased but appear to be slowing. The Fed is still committed to lowering the inflation rate. From the crypto market, BTC has succeeded to go above the 21-week EMA. Check out the full analysis in the following article.
Pintu’s trader team has collected various important data about macroeconomic analysis and crypto market movement over the past week, summarized in this Market Analysis. However, you should note that all information in this Market Analysis is for educational purposes, not financial advice.
block-heading joli-heading" id="article-summary">Article Summary
- 💼 Private sector employment increased by 235.000 jobs in December and the annual pay was up 7.3% year-over-year.
- 💡 Annual inflation in the Eurozone came in at 9.2% in December, falling more than the expected 9.5%.
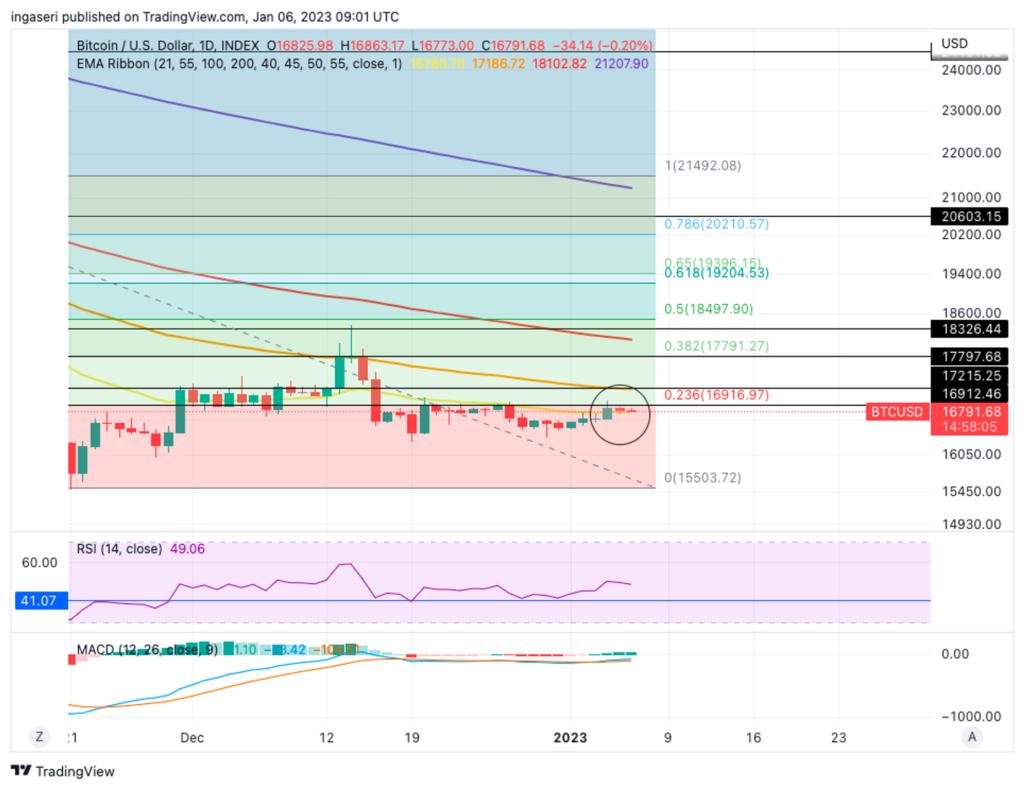
- ⚡ BTC has finally succeeded to go above the 21 weeks EMA for the first time since mid-December last year.
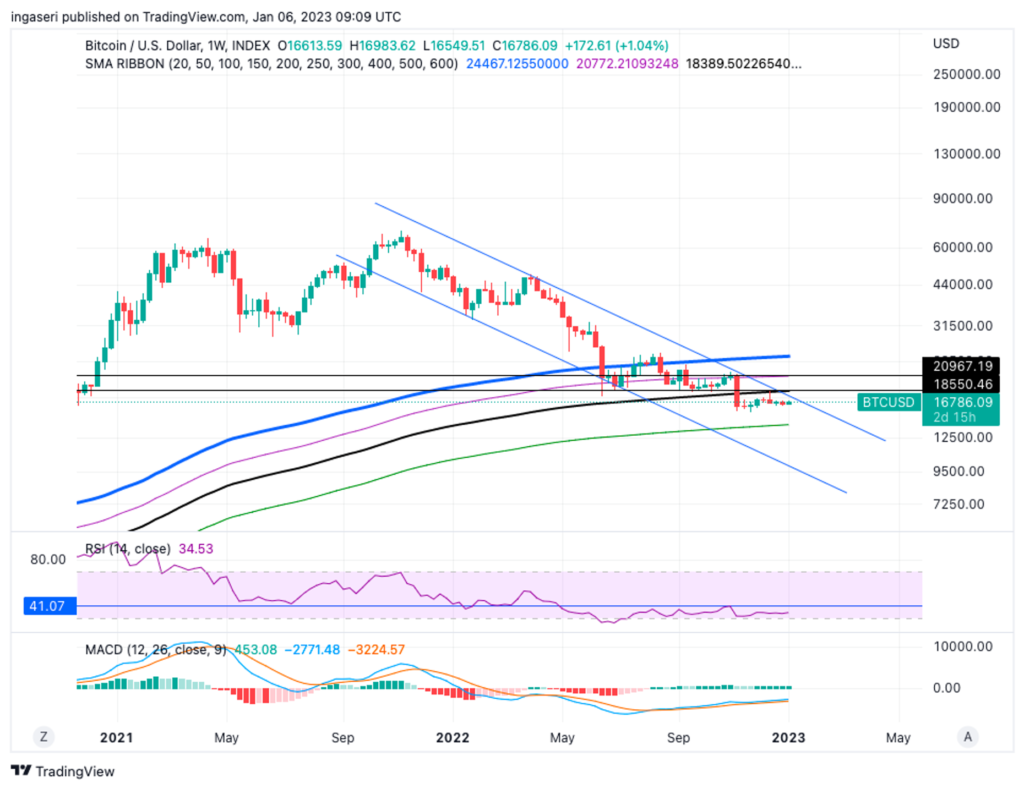
- 📉 On the weekly chart, BTC is still in a falling wedge pattern.
Macroeconomy Analysis
Private sector employment increased by 235.000 jobs in December. Annual pay was up 7.3% year-over-year, according to the December ADP® National Employment Report. This strong labor market worried the market, the pushing equities market down for fear of having the fed funds rate stay high for a longer period.
The ADP National Employment Report is a monthly report of economic data that measures the level of non-farm private employment in the US.
Towards the end of the week, however, markets rally. Although the US jobs market added another 223.000 jobs in December, the job growth slowed.
This report comes a day after.
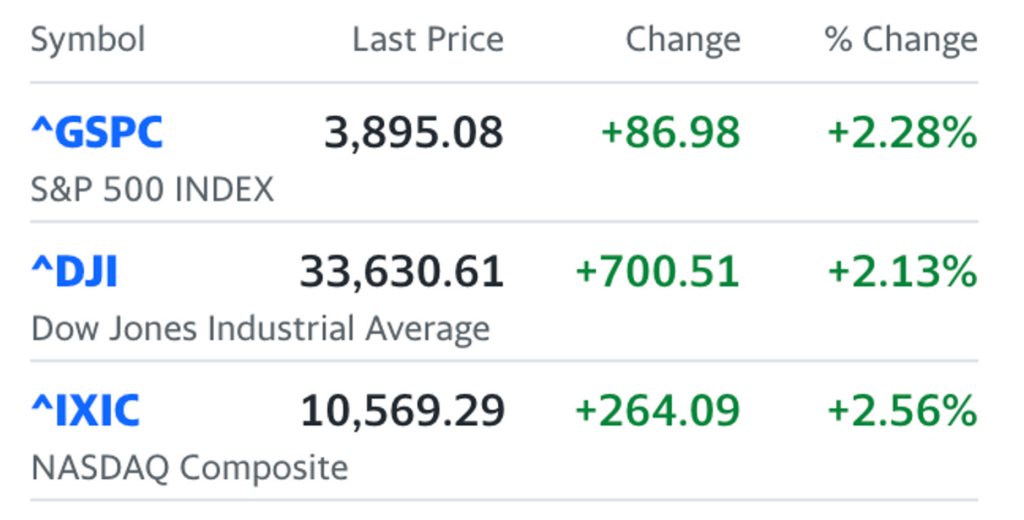
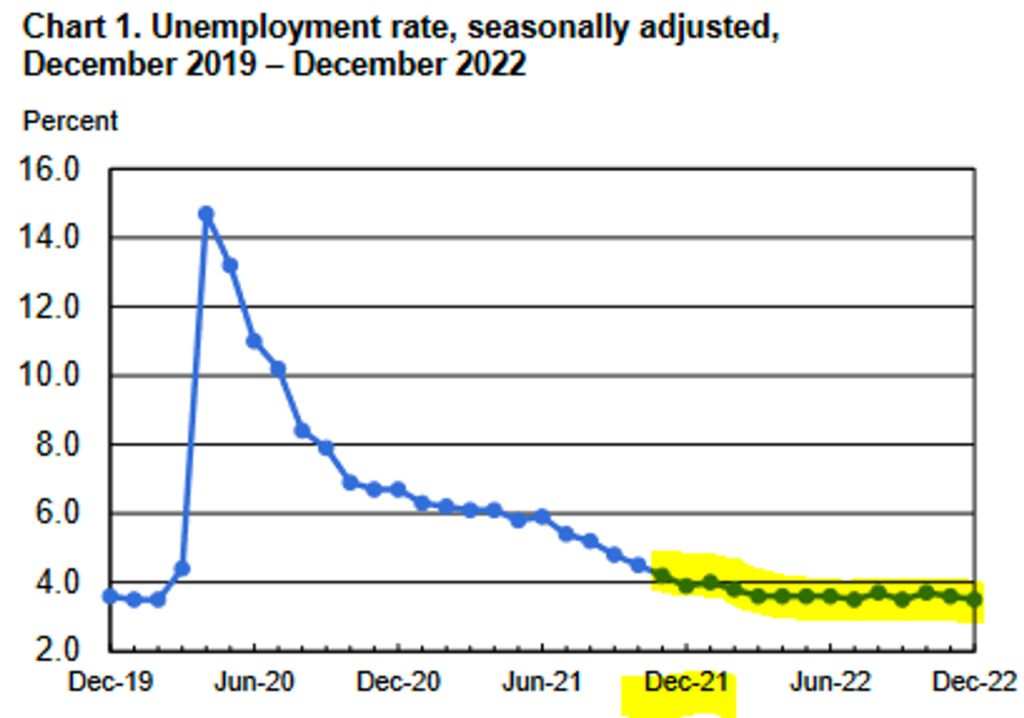
The unemployment rate falls to 3.5%, back to its pre-pandemic low. Inflation has probably peaked and is moderating, but remains fairly high.
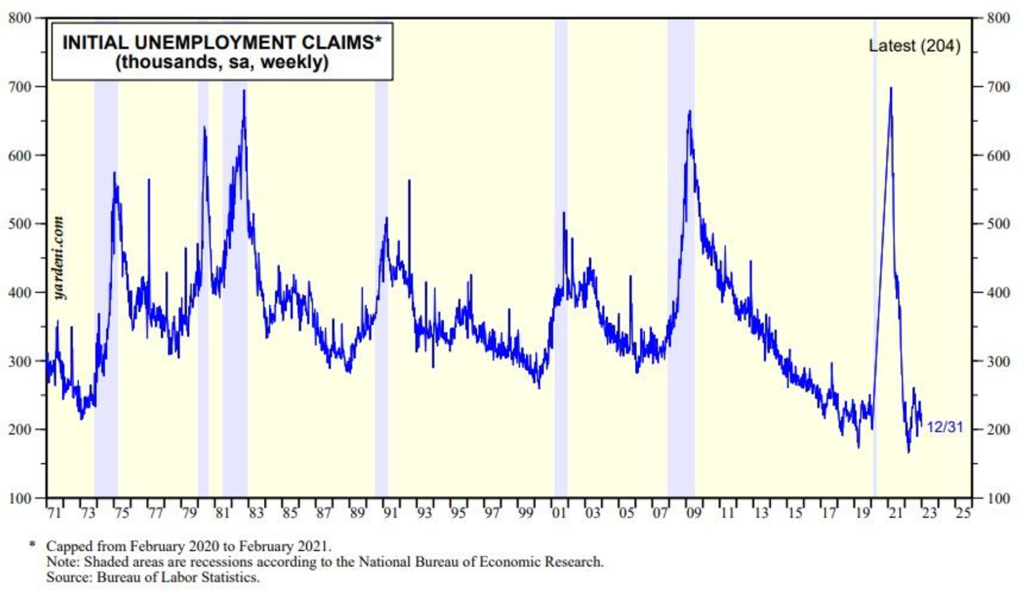
The Feds released its December minutes of meeting. After four consecutive increases of 75 basis points, the federal funds rate was raised by 50 basis points. Additionally, this year’s federal funds rate is expected to increase by 75 basis points. It is evident in the minutes that FOMC members are united in their desire to reduce inflation.
After the minutes were published, the stock market rally cooled off. An excerpt from the central bank’s minutes from its December policy meeting released Wednesday afternoon was perceived by analysts and economists as a warning to financial market participants against betting on a policy pivot in 2023. The Fed’s policy-setting Federal Open Market Committee will be forced to prolong the pain of bringing down inflation as equity rallies and other financial market developments loosen overall financial conditions.
This line from the minutes goes as follows: “Participants noted that, since monetary policy worked through financial markets, an unwarranted easing in financial conditions, especially if driven by a misperception by the public of the Committee’s reaction function, would complicate the Committee’s effort to restore price stability.”
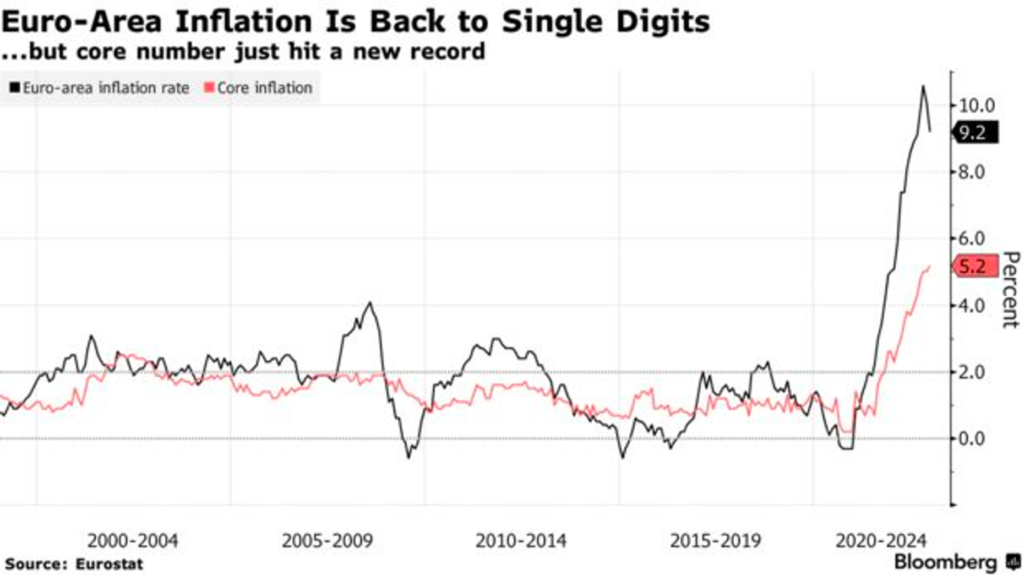
Annual inflation in Eurozone came in at 9.2%in December vs 9.5% consensus. Core inflation is at 5.2%, a record high as The European Central Bank continues its most aggressive rate hikes in its history.
Bitcoin Price Movement
BTC has finally succeeded to go above the 21 weeks EMA for the first time since mid-December last year. This is encouraging despite the current macro conditions. There is a big hurdle at 17K for BTC to push through the price point. The next resistance will be at 17.250 US dollars.
On the weekly chart, BTC is still in a falling wedge pattern. Though we are not seeing a breakout from the channel, we should be cautious about the breakout to the upside should we encounter one. At the moment, we are in the upper bound of the channel, we might experience a downward pattern should we fail to break out. Resistance at 17.500 and 18.500 US dollars.
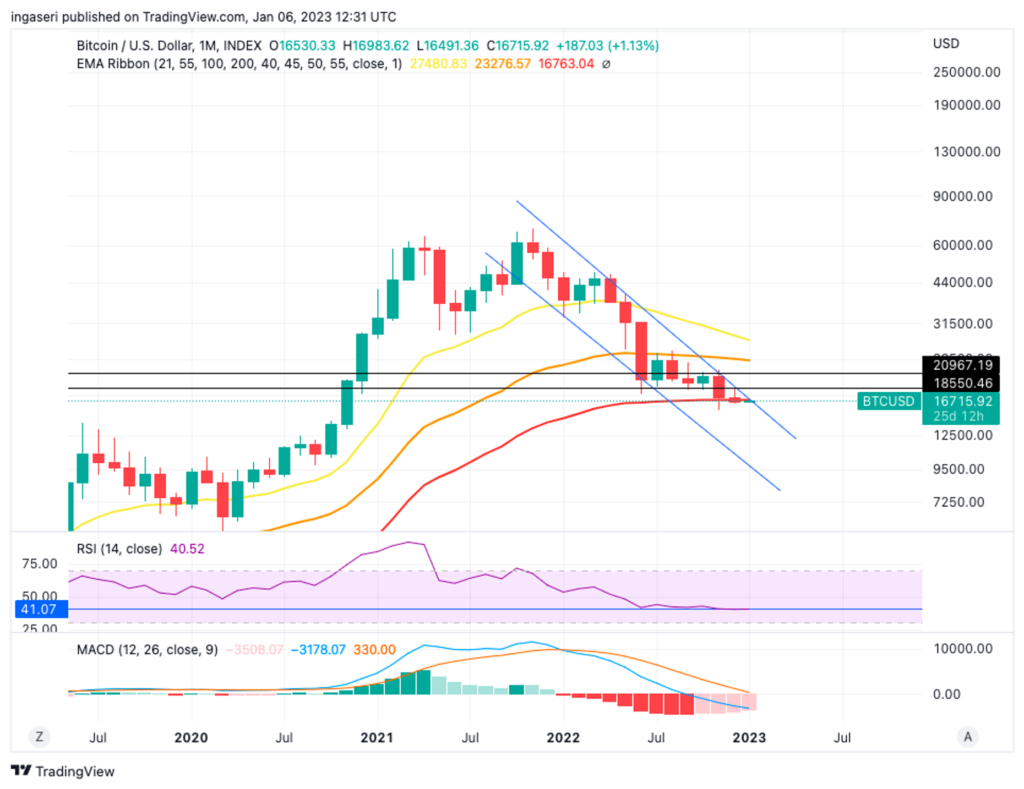
On the monthly chart, as discussed last week, we closed the monthly candle of December right at the edge of the 100-month EMA for the first time in the history of BTC. As you can see in the chart below, we are opening January’s candle below the 100-month EMA, this is a crucial point for BTC to bounce above the line and make it a support line. The other alternative would see BTC dropping further down, making the line a resistance instead.
Read also: What is Bitcoin?
Ethereum Price Movement
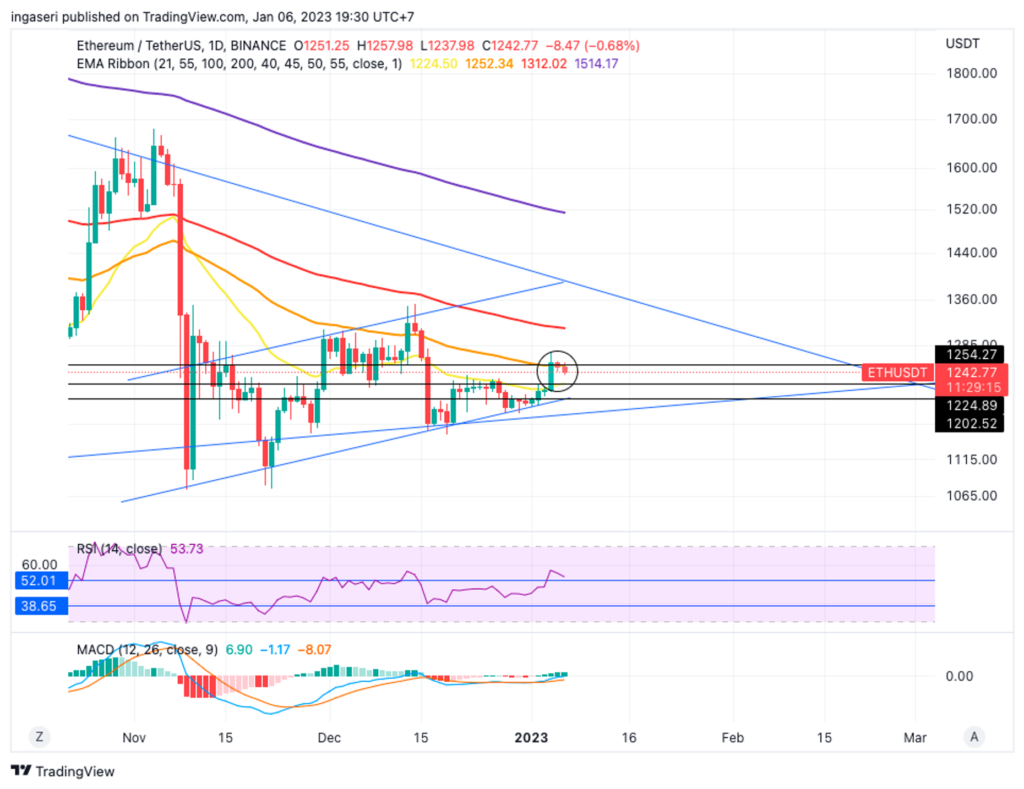
ETH manager to get itself on the edge of the 55 days EMA line only to get rejected. We are still in the sell flag channel, which represents a further continuation of a bearish pattern. Resistance is at 1.250 US dollars and support are at 1.225 and 1.200 US dollars. Watch for the RSI support at 52 as well, as breaking down the support RSI might see the price nose-diving as seen in the previous two occasions previously.
On-Chain Analysis:
📊 Exchange: As the exchange reserve continues to rise, it indicates higher selling pressure. Net deposits on exchanges are low compared to the 7-day average. Lower deposits can be interpreted as lower selling pressure.
💻 Miners: Miners’ are selling holdings in a moderate range compared to its one-year average. Miner’s revenue is in a moderate range, compared to its one-year average.
🔗 On-Chain Indicators: More investors are selling at a loss. In the middle of a bear market, it can indicate a market bottom. Long-term holders’ movement in the last 7days was lower than the average. They have the motive to hold their coins. Investors are in a Capitulation phase where they are currently facing unrealized losses. It indicates the decreasing motive to realize loss which leads to a decrease in sell pressure.
🏦Derivatives: Long-position traders are dominant and are willing to pay short traders. Selling sentiment is dominant in the derivatives market. More sell orders are filled by takers. As open interest decreases, it indicates investors are closing futures positions and the possibility of trend reversals. In turn, this might trigger the possibility of a long/short squeeze caused by sudden price movement or vice versa.
📉 Technicals: Relative Strength Index (RSI) indicates a neutral condition. stochastic It indicates a neutral condition where the current price is in a moderate location between the highest-lowest range of the last 2 weeks.
Read also: Introduction to Technical Analysis in Cryptocurrency
Altcoin News
- SOL spikes almost 40% in a week: Days after dipping below 10 US dollars, the Solana blockchain’s SOL coin jumped over 40% and reached 13 US dollars on January 6, 2023. It is because of a surge of interest in BONK, the first meme coin in the Solana ecosystem. BONK spiked more than 2000% in a day and the price of SOL increased at the same time.
- Shopify partnered with Avalanche: Shopify, an online store-building platform headquartered in Canada, integrated its system with Avalanche last Thursday, January 5, 2023. This partnership allows Shopify merchants to create, mint, and sell NFTs on the Avalanche blockchain. NFTs created by merchants will automatically turn into ‘products’. In addition, buyers who do not have a crypto wallet will automatically receive an e-mail to create a crypto wallet when they purchase NFTs.
More News from Crypto World in the Last Week
- DeFi protocol Sushi will shutter two products: Sushi will deprecate Kashi (Sushi Lending) and Miso (Sushi Launchpad). They would be shuttered because of low public interest and Sushi aims to focus on its main function as a DEX or decentralized exchange. According to DefiLlama, on Tuesday, SushiSwap, the DEX, had over 390 million US dollars in locked token value, while Kashi had a little over 800.000 US dollars in locked assets.
- Indonesia to Establish ‘Crypto Stock’ Exchange by 2023: Indonesian financial watchdog Bappebti, had planned to launch ‘crypto stock’ at the end of 2021, but it had difficulty finding benchmark countries that had it. This crypto stock in Indonesia will be similar to the Indonesia Stock Exchange. It will ensure that crypto asset transactions are regulated and secured. For information, Pintu, Indodax, and Tokocrypto are called Physical Crypto Asset Traders in Indonesia.
Crypto Market Price Over the Past Week
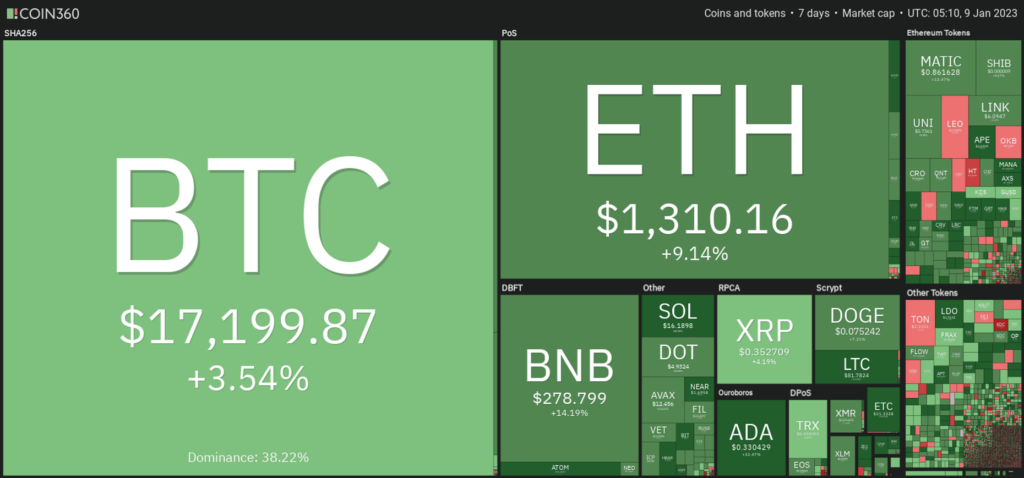
Cryptocurrencies With the Best Performance
- Lido DAO (LDO) +51.29
- Solana (SOL) +36.45%
- Ethereum Classic (ETC) +19.71
Cryptocurrencies With the Worst Performance
- Huobi Token (HT) -8.51%
- Unus Sed Leo (LEO) -5.59%
- Tron (TRX) -4.90%
References
- Owen Fernau, SOL Soars 36% As Bonk Memecoin Becomes First Hit of 2023, The Defiant, accessed 6 Januari 2023
- Ary Palguna, Harga Solana Naik 40% Dalam Sepekan, Ini Analisis Pergerakan Harga Selanjutnya!, Coinvestasi, accessed 6 Januari 2023
- Anisa Giovanny, Breaking! Binance Resmi Akuisisi Tokocrypto, Coinvestasi, accessed 23 December 2022.
- Samuel Haig, Uniswap Allies With MoonPay to Bolster Debit Card Transfers, The Defiant, accessed 23 Desember 2022.
- Caleb Naysmith, Donald Trump’s NFT Collection Is Breaking Records, What Does This Mean for the Industry?, Yahoo Finance, accessed 24 Desember 2022
Share


