Market Analysis Jun 24th, 2024: Bitcoin is testing support at $64,000

Following the Federal Reserve’s (Fed’s) decision to halt interest rate cuts and the German government’s $325 million BTC sell-off, which contributed to BTC prices hovering around $64,000, the crypto market continued to come under immense pressure last week. However, BTC still has a chance to build a strong foundation and reverse the price trend in a positive direction, supported by improving macroeconomic data. Check out the analysis below.
As usual, the Pintu trading team has gathered critical information and analyzed the general economic situation and the crypto market’s movements over the past week. However, it should be noted that all information in this Market Analysis is intended for educational purposes, not as financial advice.
Market Analysis Summary
- 🚨 If BTC drops below $65,000, the 20-day and 50-day Exponential Moving Average (EMA) could cause further market destabilization and test the support levels at $64,000 and $62,500.
- 🏪 Retail spending in May fell short of expectations as consumers continued to grapple with persistent inflation.
- 📉 US consumer sentiment in June hit a seven-month low.
- 📈 While initial jobless claims have been trending upward since January, the increase is unlikely to sway the Fed’s decision in July
Macroeconomic Analysis
Retail Sales
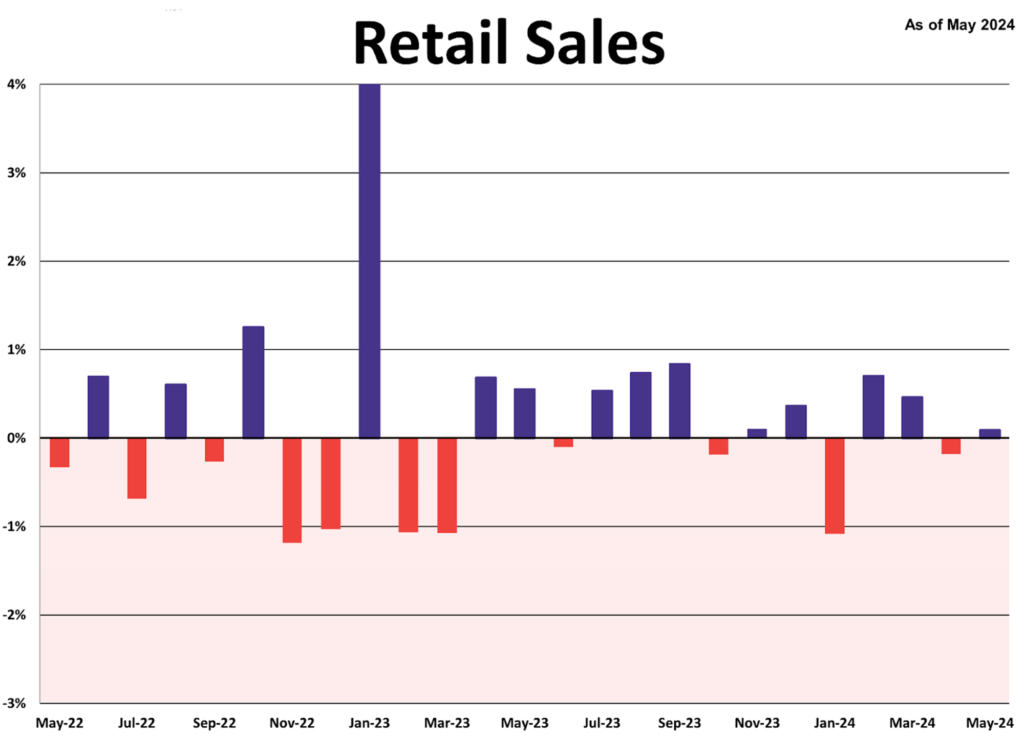
Retail spending in May fell short of expectations as consumers continued to grapple with persistent inflation.
According to a Commerce Department report released Tuesday, seasonally adjusted sales edged up by only 0.1% for the month, slightly below the Dow Jones estimate of 0.2%. Despite this modest gain, it was an improvement over the revised 0.2% drop in April.

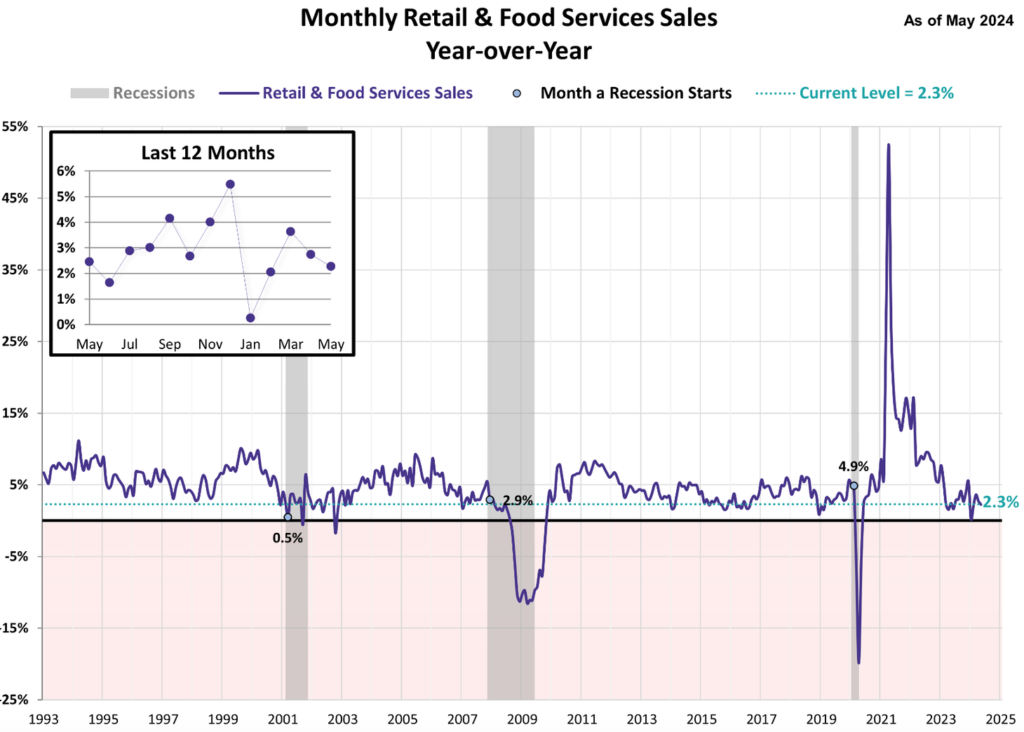
Year-over-year, sales increased by 2.3%.

Excluding the automotive sector, sales declined by 0.1%, contrary to the anticipated 0.2% increase. Lower gas prices contributed to a 2.2% decline in gas station receipts, which was partially offset by a 2.8% rise in sales at sporting goods, music, and book stores. Online sales saw a 0.8% increase, while bars and restaurants experienced a 0.4% decline, and furniture and home furnishing stores reported a 1.1% drop.
Following the release of this data, stock market futures remained relatively flat, and Treasury yields fell. Investors remain concerned about the economic outlook and its implications for future Fed policy. Given that consumer spending accounts for about 65% of economic activity, any signs of weakening could signal slower growth and potentially prompt the Fed to consider cutting interest rates.
Recent inflation figures have been somewhat promising, but consumer spending continues to show strain from over two years of rising prices. The Commerce Department’s preferred inflation measure for the Fed indicated an annual rate of 2.7% in April, or 2.8% when excluding food and energy, still above the Fed’s 2% target.
Market expectations are currently aligned with the possibility of two quarter-point interest rate cuts this year, although Fed officials recently suggested only one reduction is likely. In light of the retail spending data, traders increased their bets on the likelihood of rate cuts, with some even pricing in a 23% chance of three cuts in 2024, according to CME Group’s FedWatch tool.
Other Economic Indicators
- Michigan Consumer Sentiment: In June, consumer sentiment hit its lowest point in seven months, as reported in the preliminary Michigan Consumer Sentiment Index. The index decreased by 3.5 points, or 5.1%, landing at 65.6, down from May’s final figure. This recent reading fell short of the anticipated 72.1.
- NY Empire State Manufacturing Index: Manufacturing activity in New York State experienced a slight downturn in June, as indicated by the Empire State Manufacturing survey. The General Business Conditions diffusion index improved to -6.0, up from -15.6 in May. This latest figure exceeded the expected forecast of -12.5.
- Jobless Claim: Initial jobless claims last week fell by 5,000 to 238,000, nearing a ten-month peak, likely due to seasonal factors. In contrast, new housing starts in May plunged to their lowest point since June 2020, with a report of 1.277 million units on a seasonally adjusted basis, significantly lower than the forecast of 1.7 million units. This mixed data makes it difficult to predict the future direction of the economy and complicates the Fed’s task. However, the Fed’s task is complicated by this mixed data, although jobless claims have been trending upward since January. This upward trend, however, is unlikely to influence their July decision. If this trend continues into August with inflation remaining low, the Fed may consider a rate cut in September.
BTC Price Analysis
BTC bulls have resumed their charge following the news that MicroStrategy has added more coins to its portfolio. This positive development has spurred a broader market rally, with prices climbing across various tokens.
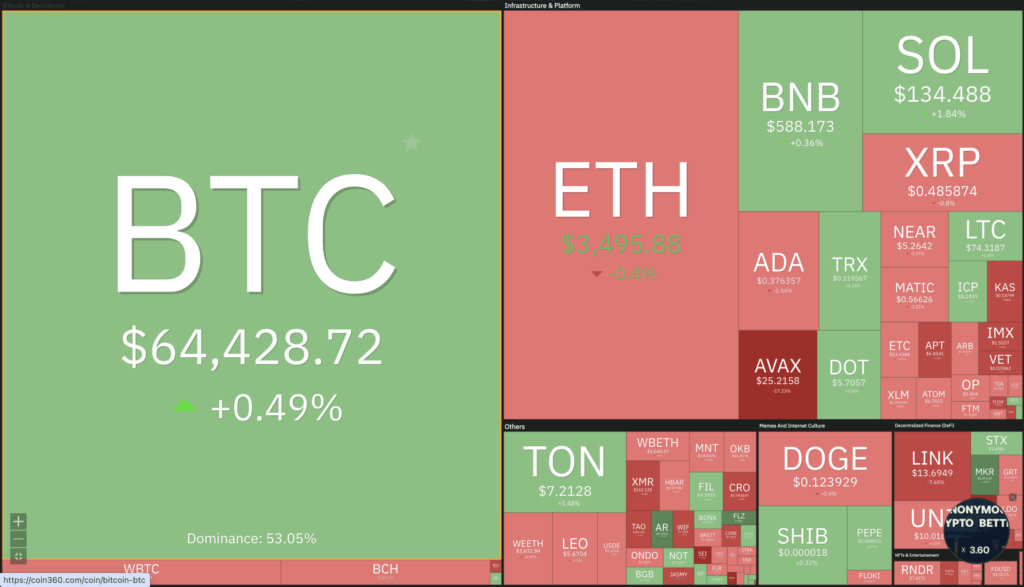
In a brief span, BTC has risen by 1.1%, reaching $65,900 This surge has also benefited ETH, which increased by 1.2% to $3,580. Additionally, other altcoins, including TON, NEAR, FET, and INJ, have seen even more substantial gains.
If the bullish trend continues, the crypto market may recover the losses incurred since last week. The market downturn was triggered by the Fed’s hawkish stance on interest rate cuts, which included a revision to just one potential rate cut in 2024 without specifying the timing.
Opinions among economists vary, with some predicting a rate cut as early as September, while others anticipate it may not occur until December.

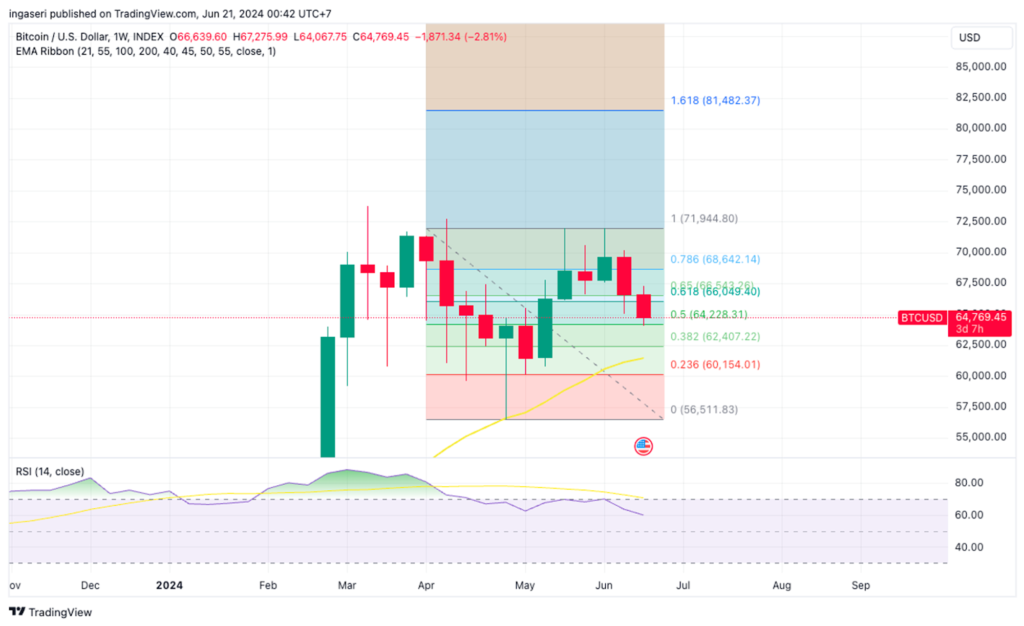
This week, BTC declined by 2.8%, falling from the upper boundary of the Fibonacci golden pocket area. It then found support at the 0.5 Fibonacci retracement level of 64,228. If BTC closes the week above this support line, it could establish a strong foundation, potentially leading to a price reversal given improved macroeconomic data.
Just above $70,000, an inverse head and shoulders pattern is anticipated, which, if confirmed, suggests a potential 18% breakout to $84,000, marking a historical milestone for BTC.
On the flip side, if BTC’s price falls below $65,000, the 20-day and 50-day exponential EMA could form a death cross pattern, threatening the recovery. This scenario might lead to further market destabilization, testing support levels at $64,000 and $62,500.
Nevertheless, a trend reversal could occur with the upcoming launch of ETH ETFs, expected around July 2. The crypto community sees the approval of the second ETF, and especially an ETH ETF, as a crucial advancement for the industry. This development could significantly impact the prices of Bitcoin and other altcoins.
On-Chain Analysis
- 📊 Exchange: As the exchange reserve continues to rise, it indicates higher selling pressure. Net deposits on exchanges are high compared to the 7-day average. Higher deposits can be interpreted as higher selling pressure.
- 💻 Miners: Miners’ are selling less holdings compared to its one-year average. Miner’s revenue is in a moderate range, compared to its one-year average.
- 🔗 On-Chain: More investors are selling at a profit. In the middle of a bull market, it can indicate a market top. Long term holders’ movement in the last 7 days was lower than the average. They have a motive to hold their coins. Investors are in a belief phase where they are currently in a state of high unrealized profits.
- 🏦 Derivatives: Long-position traders are dominant and are willing to pay to short traders. Buying sentiment is dominent in the derivatives market. More buy orders are filled by takers. As open interest decreases, it indicates investors are closing futures positions and possibility of trend reversals. In turn, this might trigger the possibility of long/short-squeeze caused by sudden price movement or vice versa. versa.
- 🔀 Technicals: RSI indicates an oversold condition where 81.00% of price movement in the last 2 weeks have been down and a trend reversal can occur. Stochastic indicates an oversold condition where the current price is close to the bottom of the last 2 weeks and a trend reversal can occur.
News About Altcoins
- Ether ETFs Poised for Early July Launch with Updated Proposals. Asset managers like VanEck, BlackRock, Grayscale, and Invesco Galaxy Digital have submitted revised proposals for Ethereum exchange-traded funds (ETFs) to the U.S. Securities and Exchange Commission (SEC), aiming for a launch in the first week of July. These updated S-1 Registration Statements, required for the funds’ listing on Wall Street exchanges, follow recent SEC approvals allowing major asset managers to list and trade spot Ether ETFs. VanEck’s filing sets a 0.20% management fee, potentially pressuring BlackRock which hasn’t yet revealed its fee structure. Fidelity’s update shows a $4.7 million seeding by FMR Capital, while Bitwise anticipates a potential $100 million investment from Pantera Capital at launch. Additionally, Hashdex seeks approval for a combined Bitcoin and Ether ETF, having previously shelved its Ether-only plan.
News from the Crypto World in the Past Week
- German Government Moves Bitcoin from Seized Wallet, Sparking Market Impact Concerns. A crypto wallet labeled “German Government (BKA)” by Arkham, a crypto on-chain analytics firm, moved 6,500 BTC on June 19, leading to speculation that the German government might be selling its Bitcoin holdings. The wallet, which held nearly 50,000 BTC since February 2024, transferred 6,500 BTC to another address and then moved 2,500 BTC to its own address. The funds were initially seized from the pirated movie website operator Movie2k. Although not all transferred funds were liquidated, some transactions involved crypto exchanges Kraken and Bitstamp. Currently, the German government-linked wallet holds 43,359 BTC, raising concerns about the potential market impact of liquidating such a large Bitcoin stash. This event follows a global trend where governments sell seized BTC, such as the United States selling Bitcoin confiscated from the Silk Road.
Cryptocurrencies Market Price Over the Past Week

Cryptocurrencies With the Best Performance
- Pendle +18,73%
- Ethereum Name Service +13,56%
- Maker +7,71%
- Lido DAO +5,81%
Cryptocurrencies With the Worst Performance
- zkSync (ZK) -37,13%
- LayerZero (ZRO) -28,26%
- Chiliz -27,29%
- digwifhat (WIF) -26,09%
References
- Prashant Jha, Is Germany selling its BTC? Arkham-tagged wallet sparks curiosity, cointelegraph, accessed on 22 June 2024.
- Ana Paula Pereira, Asset managers update proposals for Ether ETFs, eyeing July launch, cointelegraph, accessed on 22 June 2024.
Share
Related Article
See Assets in This Article
0.0%
0.0%
0.0%
0.0%
0.0%
MKR Price (24 Hours)
Market Capitalization
-
Global Volume (24 Hours)
-
Circulating Supply
-


