Market Analysis Jun 3rd, 2024: $69,000 is a Key Support Level for BTC

After experiencing a decline in April, Bitcoin closed May with a notable monthly gain of 10.69%. A significant driver of this positive trend was the launch of the Ethereum Exchange-Traded Fund (ETF). But what are the predictions for BTC as we move into June? Read the analysis below to find out.
As usual, the Pintu trading team has gathered critical information and analyzed the general economic situation and the crypto market’s movements over the past week. However, it should be noted that all information in this Market Analysis is intended for educational purposes, not as financial advice.
Market Analysis Summary
- ✍🏻 We need to see a $69,000 shift in BTC from being a resistance level to becoming a support level.
- 📊 The U.S. economy grew at a slower pace than expected at the start of the year. Real GDP increased at an annual rate of 1.3% in Q1 2024.
- 📈 The four-week average of claims, which smooths out some of the week-to-week fluctuations, also increased slightly to 222,500.
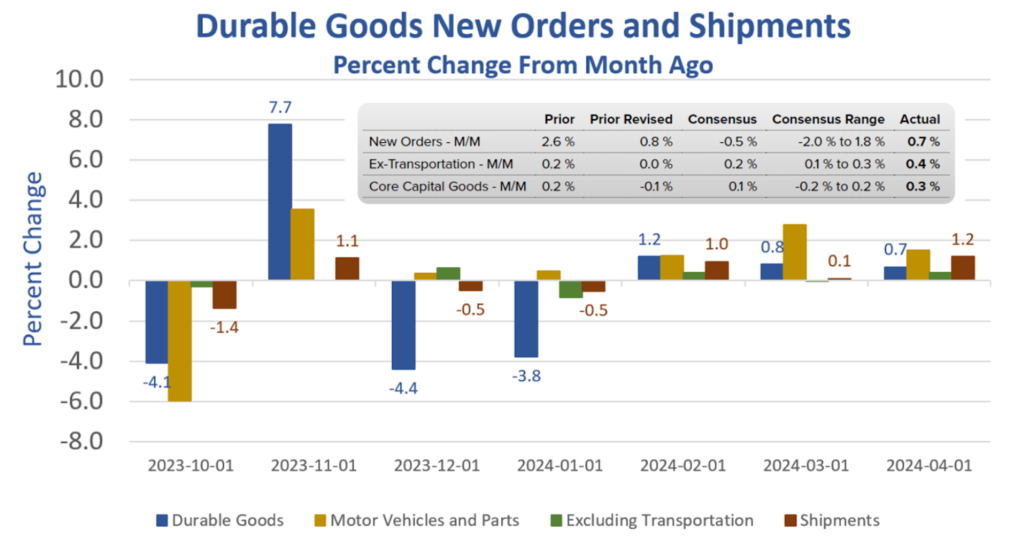
- 🏭 Durable Goods Orders in the US increased by 0.7% in April.
- 📉 Consumer sentiment dropped over 10% in May, reaching a six-month low.
Macroeconomic Analysis
Durable Goods

The US Census Bureau reported on Friday that Durable Goods Orders in the US rose by $1.9 billion, or 0.7%, to $284.1 billion in April. This followed a revised 0.8% growth in March (originally reported as +2.6%) and exceeded market expectations of a 0.8% decrease.
Excluding transportation, new orders increased by 0.4%. Excluding defense, new orders were virtually unchanged. Transportation equipment, which has risen for three consecutive months, led the increase with a $1.1 billion, or 1.2%, rise to $96.2 billion.
Other Economic Indicators
- Michigan Consumer Sentiment: Consumer sentiment dropped by over 10% in May, reaching a six-month low, as reported by the final Michigan Consumer Sentiment Index. The index fell by 8.1 points to 69.1 from April’s final reading, exceeding the forecast of 67.4. This significant decline, marking the lowest level in about five months, was driven primarily by a sharp drop in the year-ahead outlook for business conditions, while perceptions of personal finances remained stable. Consumers expressed concerns about the labor market, expecting higher unemployment rates and slower income growth, and anticipated persistently high interest rates, all of which could negatively impact consumer spending.
- Jobless Claim: For the week ending May 25, the preliminary figure for seasonally adjusted initial claims was 219,000, marking an increase of 3,000 from the previous week’s revised level. The prior week’s level was adjusted upward by 1,000, from 215,000 to 216,000. The 4-week moving average rose by 2,500 to 222,500, up from the previous week’s revised average of 220,000 (originally 219,750).
- GDP Growth Rate: The U.S. economy grew at a slower pace than expected at the start of the year. Real gross domestic product (GDP) increased at an annual rate of 1.3% in Q1 2024, according to the second estimate. This growth rate is below the forecasted 1.6% and represents a deceleration from the Q4 2023 GDP final estimate of 3.4%.
- Goods Trade Balance: According to the Commerce Department’s advanced estimate released Thursday, the U.S. trade deficit in goods widened by 7.7% to $99.4 billion in April, marking the largest deficit since May 2022. Economists surveyed by Econoday had predicted the deficit would expand to $92.5 billion. The report also indicated a 0.2% increase in wholesale inventories in April, following a 0.4% decline in the previous month. Advanced retail inventories rose by 0.7% after a 0.1% increase in March, with retail inventories excluding autos up by 0.3%.
BTC Price Analysis
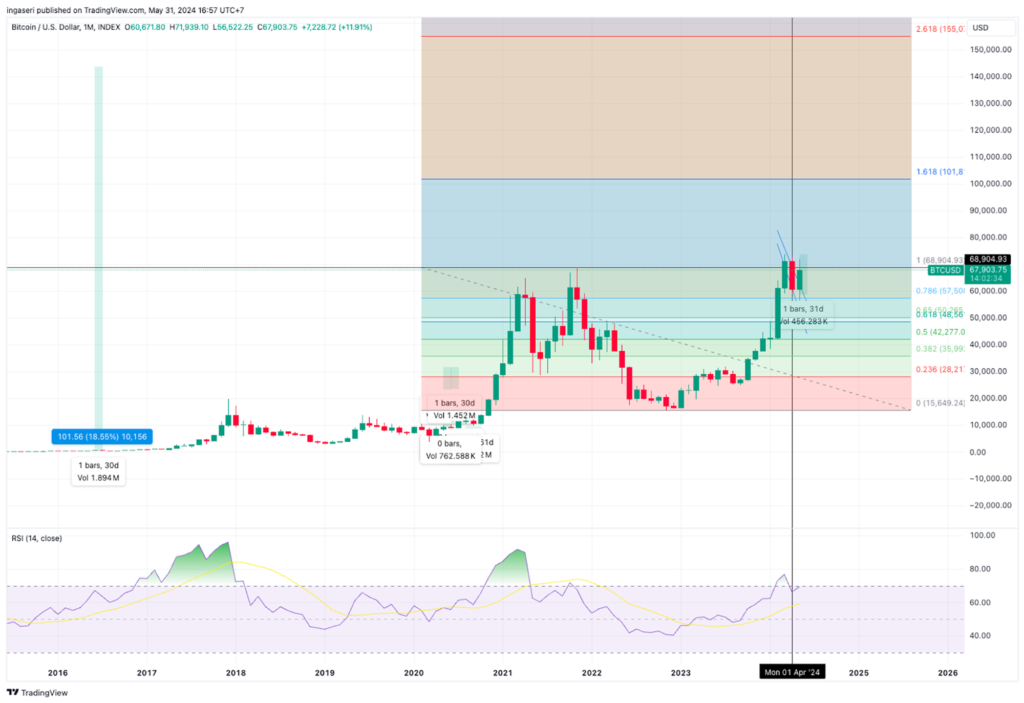
BTC is set to end May in positive territory, but a larger struggle persists. Almost three months after reaching its latest all-time high of $73,800, BTC/USD has not returned to those levels or continued its price discovery.
We need to see $69,000 shift from being a resistance level to becoming a support level to keep the price within the current range. A monthly close above or below $69,000 will indicate whether we are preparing for the next upward move or continuing to consolidate within this range.

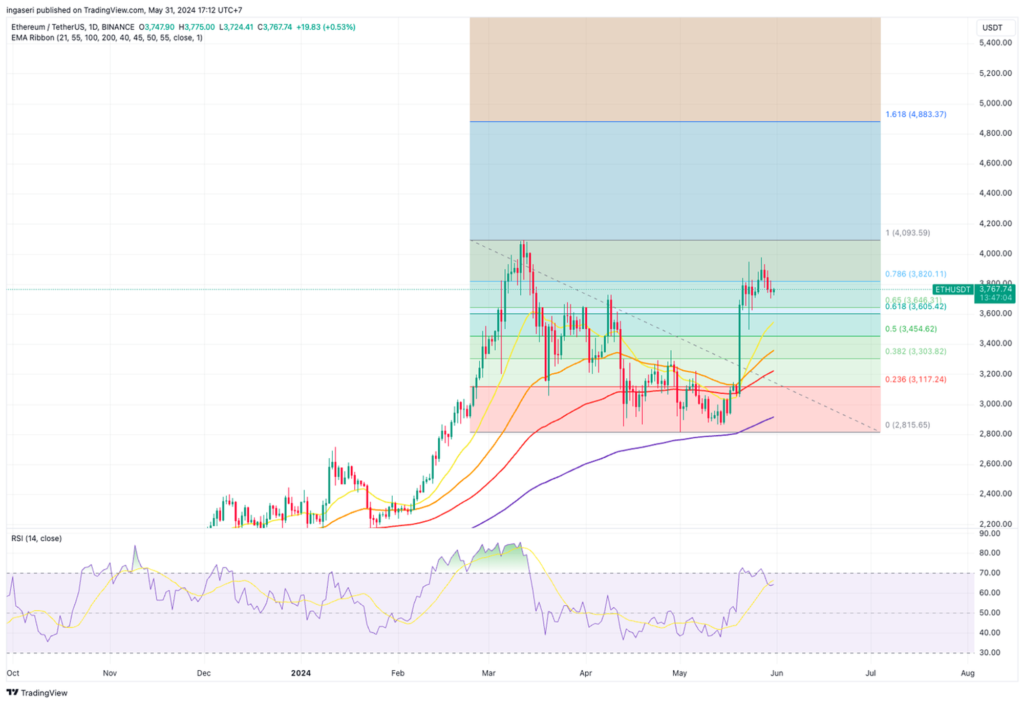
The approval of the spot ETH ETF by the SEC in May was a significant and bullish event for the crypto market. In anticipation of this approval, ETH prices rose by 20% in May. However, the SEC only approved the 19b-4 filing, delaying the actual listing for trading.
19b-4 proposal is a form filed with the U.S. Securities and Exchange Commission (SEC) to request a change in the rules. This allows for new financial products, like Exchange-Traded Funds (ETFs), to be listed and traded on exchanges. In the case of Ethereum ETFs, several large asset managers, including BlackRock, Grayscale, and Bitwise, have recently filed or amended their 19b-4 proposals with the SEC.
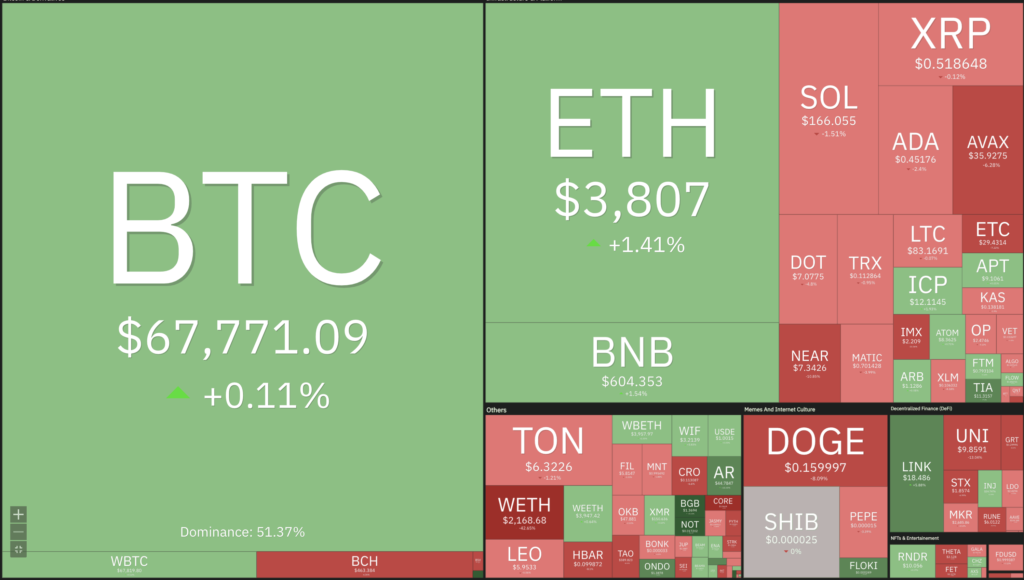
Since the ETH ETF approval, the crypto market has exhibited a bearish sideways movement, with ETH remaining below $4,000 and BTC below the $70,000 threshold. Currently, the crypto market is experiencing bearish momentum, correcting from the bullish surge of the previous two weeks. However, since the beginning of the week, ETH has shown a concerning trend, suggesting a weakening of bullish influence.
The cross-border market correction led to a 2.58% drop in the price of ETH, accompanied by a significant decline in trading volume. Over the past day, ETH trading volume decreased by 11.28%, falling to $16.5 billion. This drop in volume indicates a potential decrease in buying and selling pressure, which suggests the possibility of price stagnation.
Furthermore, ETH has seen minimal price change (less than 0.10%) over the past week. This decrease in volatility indicates a wait-and-see approach among investors, possibly reflecting uncertainty about the token’s immediate future.

On-Chain Analysis
- 📊 Exchange: As the exchange reserve continues to fall, it indicates lower selling pressure. Net deposits on exchanges are high compared to the 7-day average. Higher deposits can be interpreted as higher selling pressure.
- 💻 Miners: Miners’ are selling less holdings compared to its one-year average. Miner’s revenue is in a moderate range, compared to its one-year average.
- 🔗 On-Chain: More investors are selling at a profit. In the middle of a bull market, it can indicate a market top. Long term holders’ movement in the last 7 days was lower than the average. They have a motive to hold their coins. Investors are in a belief phase where they are currently in a state of high unrealized profits.
- 🏦 Derivatives: Long position traders are dominant and are willing to pay to short traders. Selling sentiment is dominant in the derivatives market. More sell orders are filled by takers. As OI increases, it indicates more liquidity, volatility, and attention are coming into the derivative market. The increasing trend in OI could support the current ongoing price trend.
- 🔀 Technicals: RSI indicates a neutral condition. Stochastic indicates a neutral condition where the current price is in a moderate location between the highest-lowest range of the last 2 weeks.
News About Altcoins
- Meme Coin Super Cycle Drives Pump.fun Revenue to $14.12 Million. Solana-based meme coin publishing platform pump.fun has generated $14.12 million in fee revenue in the last 30 days, surpassing Uniswap Labs to become the fourth largest protocol on all blockchain networks. Even Pump.fun’s revenue is only about $6 million short of Solana’s.
News from the Crypto World in the Past Week
- Biden Vetoes Override of SEC Guidance on Crypto. US President Joe Biden vetoed a bill that aimed to rescind a Securities and Exchange Commission (SEC) bulletin setting accounting standards for companies managing crypto custody. In his letter to the US House of Representatives, Biden emphasized the importance of “appropriate safeguards to protect consumers and investors to capitalize on the innovation potential of crypto assets.” Although the House and Senate had previously approved a measure to repeal this bulletin, known as SAB 121, Biden asserted that limiting the SEC’s ability to maintain a comprehensive and effective financial regulatory framework would introduce substantial financial instability and market uncertainty. The bulletin has drawn controversy due to concerns in the crypto industry that it could deter banks from safeguarding digital assets by requiring companies managing crypto custody to record customers’ crypto holdings as liabilities on their balance sheets.
Cryptocurrencies Market Price Over the Past Week

Cryptocurrencies With the Best Performance
- Ordi (ORDI) +27,88%
- Celestia (TIA) +25,54%
- Ethereum Name Service (ENS) +21,13%
- Chiliz +11,43%
Cryptocurrencies With the Worst Performance
- Akash Network (AKT) -13,30%
- Uniswap -11,65%
- NEAR Protocol -10,91%
- Theta Network (THETA) -9,85%
References
- SolanaFloor, Pumpdotfun, X, accessed on 2 June 2024.
- Sarah Wynn, Biden vetoes bill overturning SAB 121, says standard ‘necessary’ for crypto innovation, theblock, accessed on 2 June 2024.
Share
Related Article
See Assets in This Article
BTC Price (24 Hours)
Market Capitalization
-
Global Volume (24 Hours)
-
Circulating Supply
-


