Market Analysis May 9-15: BTC Very Close to Bottom & Terra Announces Revival Plan
The latest data from the Consumer Price Index (CPI) released Wednesday (11 May 2022) showed an 8.3% increase in the consumer price index compared to April 2022. This increase was 20 bps lower than last month. However, the market reacted negatively to this number as the index forecast was lower at 8.1%. This CPI data shows that inflation is not slowing down as fast as the market had hoped, and this is suggesting that the sell-off will continue.
In addition, last week LUNA experienced a tragic moment that will go down in crypto history, where its value fell by 100%, from $119.18 on April 5 to $0. What caused LUNA to lose its price was the massive sell-off of UST (stablecoin made by Terraform Labs), which caused UST’s price to drop significantly and sent LUNA into hyperinflation. This made the price drop to as low as 0 US dollars.
The extent of the damage caused by LUNA is still unclear at this time. However, this is a tragic moment for the retail market. For those affected, note that crypto always has the potential for a free fall like last week and then rebound quickly. Please stay vigilant.
Bitcoin (BTC) Price Movement 9-15 May 2022
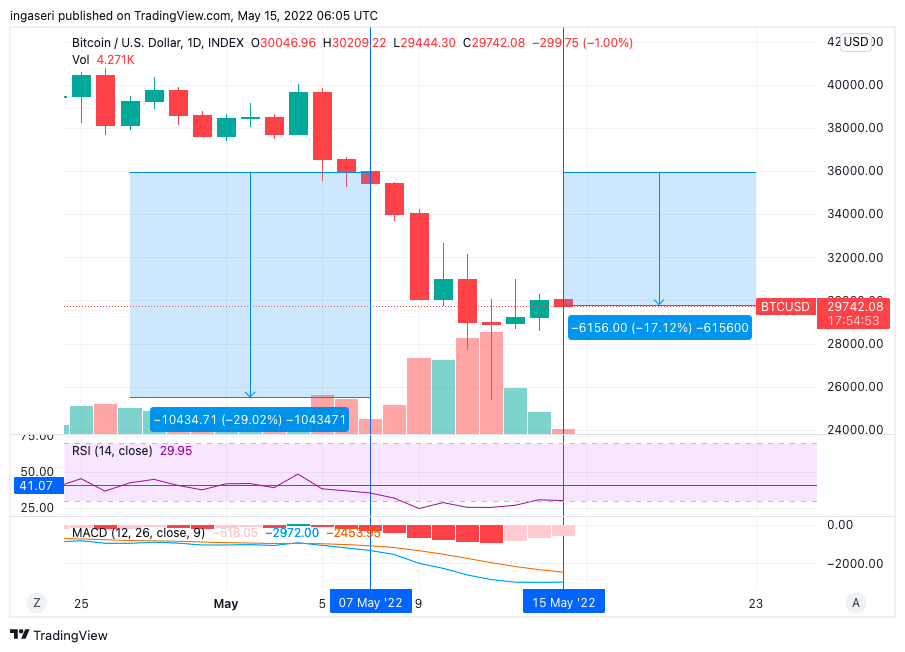
Over the past week, the market has seen BTC price drop by as much as 30% before settling at the $30,000 price point, or 17% lower compared to last week’s price. The negative market sentiment brought BTC down from $36,000 to $30,000. The worst point occurred during the UST-LUNA event on May 12, which shocked the industry and the market where BTC was at one point valued at $25,000, and then recovered to the $30,000-$31,000 range, as can be seen in the chart below.
If we look at the monthly BTC candle in the chart below, currently BTC is below the 21-month EMA. This had only happened twice before. The first was in 2014, which lasted for about a year. The second time was in 2018, which lasted for 6 months. Even though the monthly candle hasn’t closed yet, if BTC stays in its current price range then this will be the third time BTC has closed below the 21-month EMA.
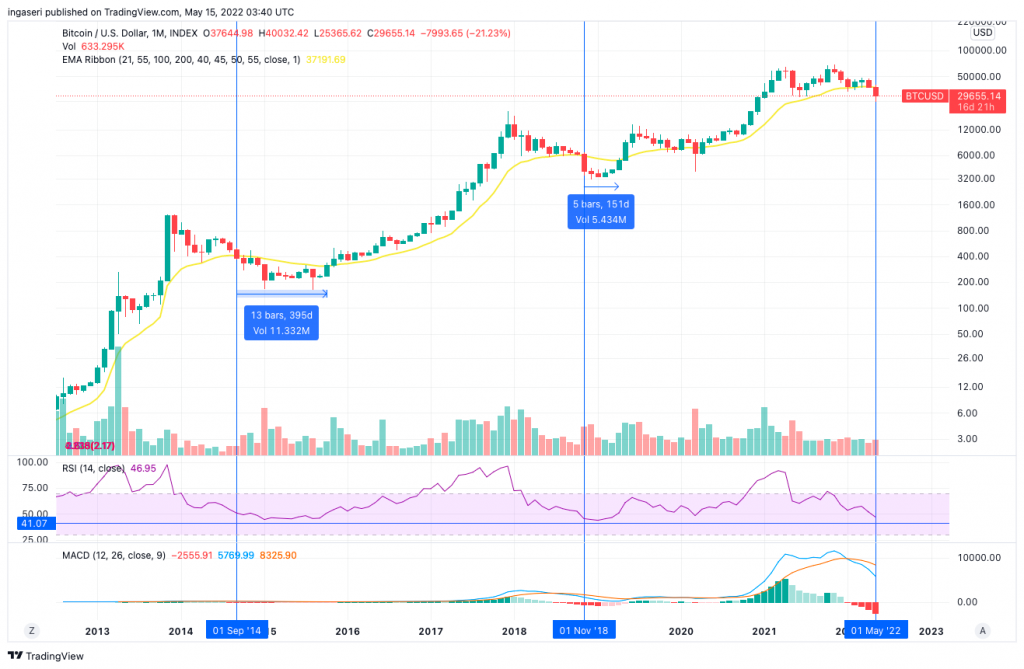
What can the market expect? The 21 month EMA will be a resistance line and BTC will probably spend quite a while to break through that resistance line. There is an argument that with each new cycle the time spent below the line will be shorter. If so, then we can expect BTC to stay below the resistance line for about the next 3-6 months. BTC will have to close above $40,000 by the end of this month to survive.
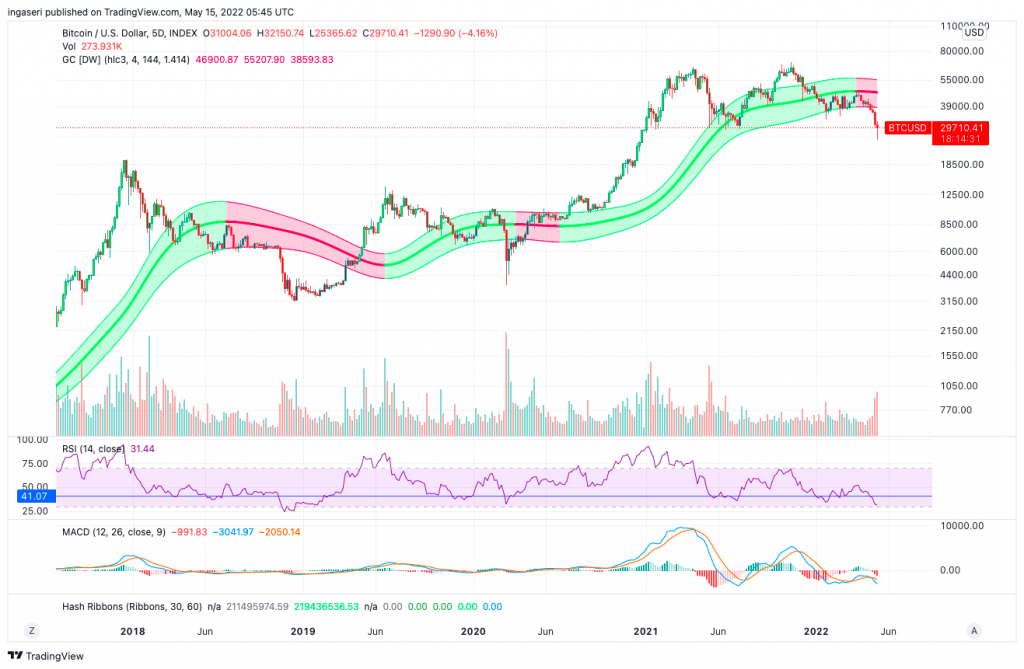
Meanwhile, the Gaussian Channel on the 5-day chart seen below has proven to be accurate and is a good indicator for Bitcoin. Currently BTC is below the lowest line of the Gaussian Channel. This has historically been a great time to do Dollar Cost Averaging (DCA). If BTC has not risen to the top of the channel, it is estimated that the market is still in a bearish sideways state.
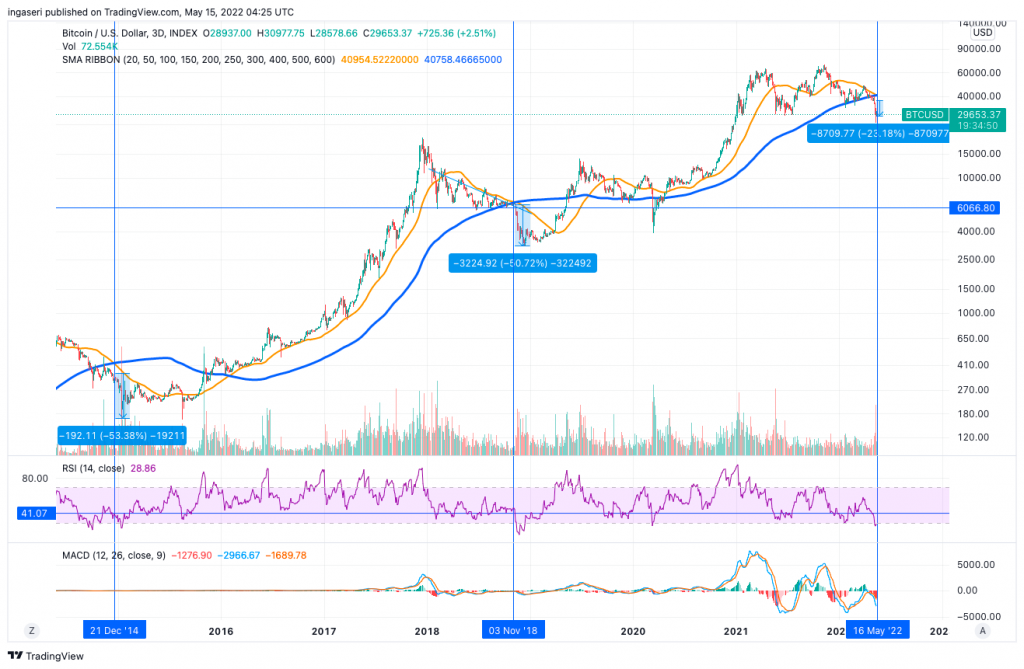
If we look at the death cross on the 3-day chart below, we can see that on the previous two occasions, BTC is expected to fall by up to 50%. If we were to use the same approximate percentage downside, we are halfway there. Anticipate a drop of up to 20-30% from the current price, with an estimated BTC price of 20,000-25,000 US dollars.
💡 A death cross is an asset price chart pattern when the shorter-term moving average crosses the longer-term moving average below it. This might be a signal of a bearish trend in the price of an asset.
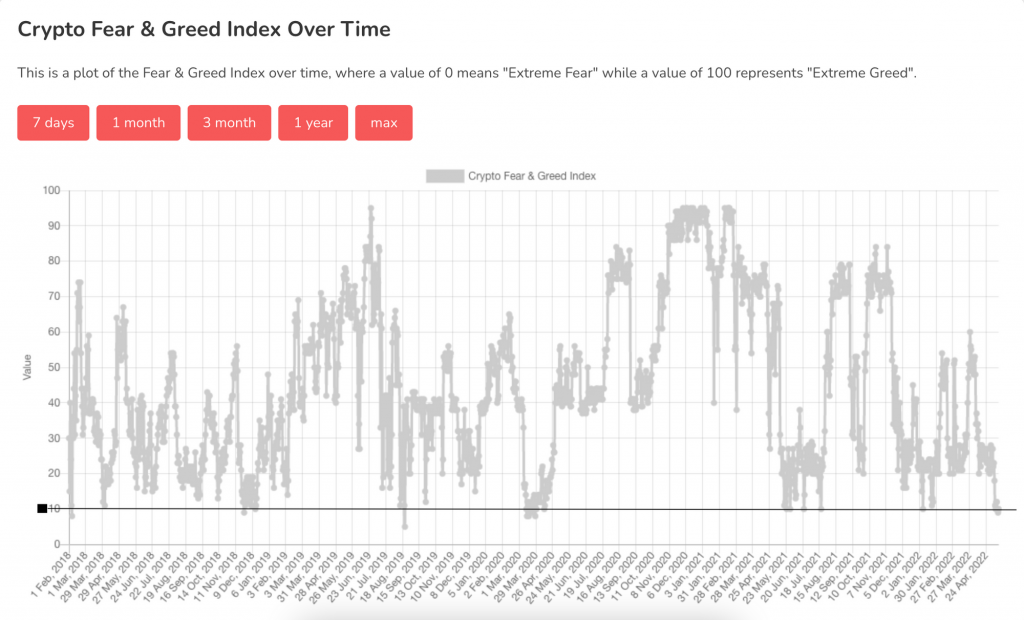
The crypto fear and greed index is currently at a level where there is typically support (at the value 10 of the index). Things can spiral swiftly at this level, reaching the bottom of the downturn.
On-Chain Analysis
Reserves or asset deposits on all exchanges are still at their lowest level in the last three years. Meanwhile spot deposits also continued the downward trend, while reserves for the Derivatives Exchange soared. Following the recent UST incident, other stablecoin reserves experienced a spike. Whales are in hold positions, while miners distribute less of their assets to exchanges which may be affected by the recent decline in BTC prices. Leverage is still relatively high, while short-term investors are selling frantically and some long-term investors are selling at a loss.
Let’s take a look at the entity adjusted dormancy flow where now (at the value of 185), we are reaching the bottom range of the green zone, where historically the green zone represents buy zone, ideal for both bottom-catching historical global lows.
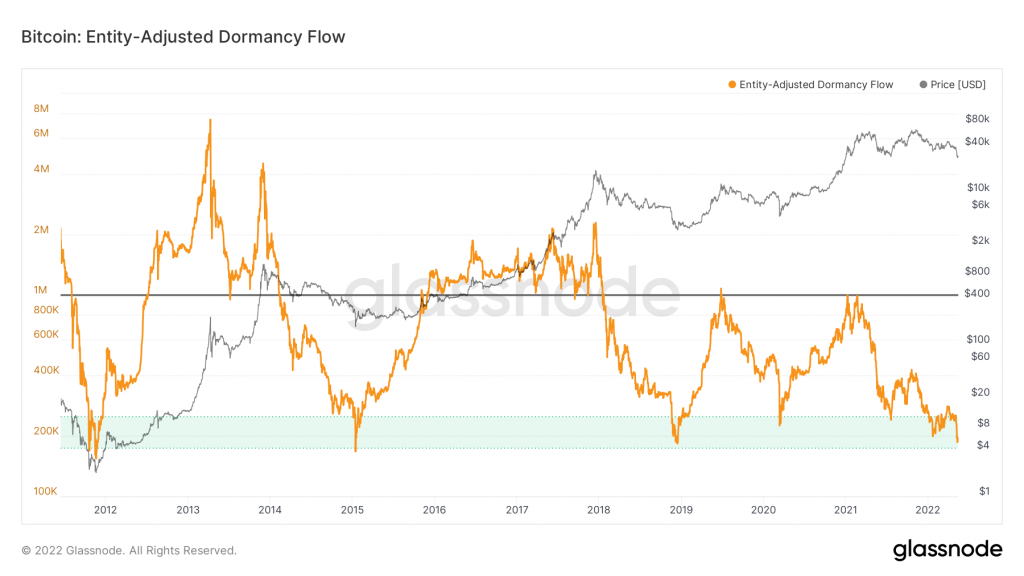
💡 Entity-adjusted Dormancy Flow is the ratio of the current market capitalization and the annualized dormancy value (measured in USD). Entity-adjusted Dormancy Flow can be used to time market lows and assess whether the bull market remains in relatively normal conditions. It helps confirm whether Bitcoin is in a bullish or bearish primary trend.
Whenever dormancy value overtakes market capitalization at the lowest longitudinal levels, the market can be considered in full capitulation — a good historical buy zone.
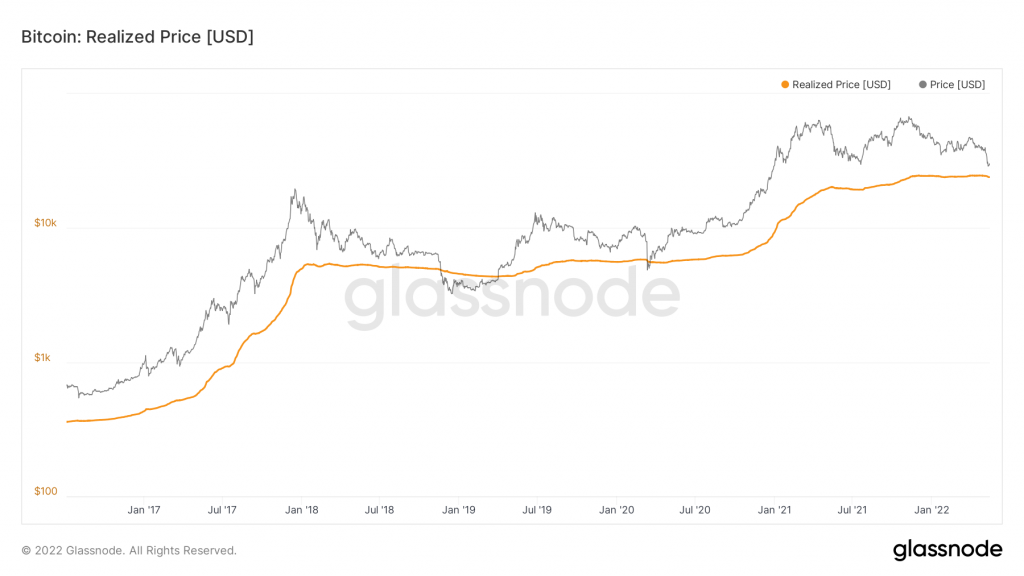
BTC is now in the “good-to-buy” zone which ranges from 20,000-30,000 US dollars. For long-term investors, now is a good time to get started with Dollar Cost Averaging (DCA). Although looking at some of the lowest price points, the realized price of BTC is not yet at 24,000 US dollars (as in the chart below), it is already very close to it. The aggregated cost base of all on-chain investors is currently at 24,000 US dollars. Any price below the realized price should be viewed as an extreme value.
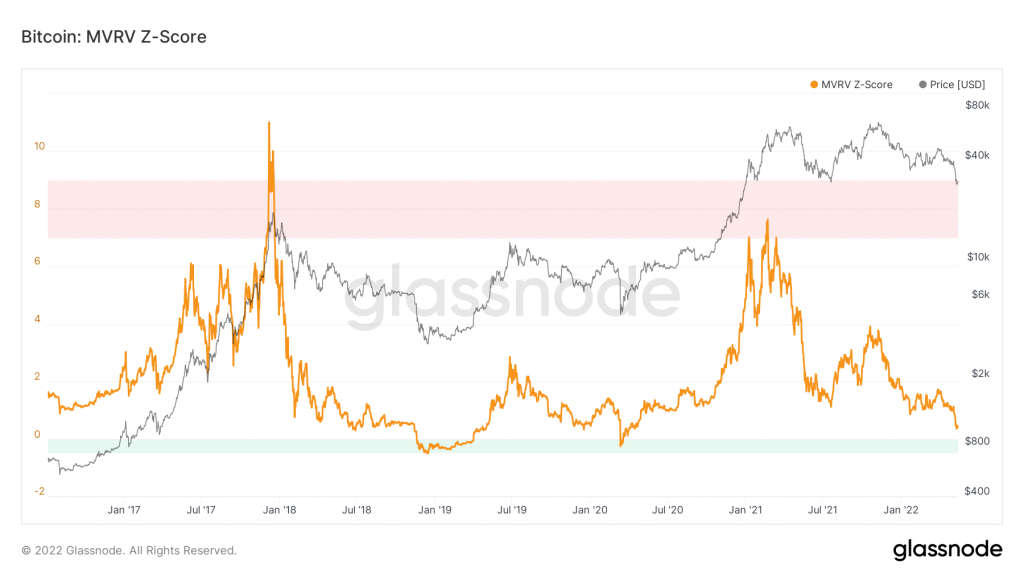
The MVRV Z-Score is another indicator used to assess when Bitcoin is over/undervalued relative to its “fair value”. When market value is significantly higher than realized value, it has historically indicated a market top (red zone), while the opposite has indicated market bottoms (green zone). Technically, MVRV Z-Score is defined as the ratio between the difference of market cap and realized cap, and the standard deviation of all historical market cap data, i.e. (market cap – realized cap) / std(market cap). Currently, we are close the entering the market bottoms.
Analysis Summary
- 📉 There is still a possibility that the BTC price will fall further. However, at this time it is more appropriate to buy using the DCA strategy rather than sell.
- 🚨 Playing in the sideways market at this time is quite risky.
- 🤔 How long will BTC be in this position before finally recovering? If BTC remains below the 21-month EMA until the end of this month, then it is expected that over the next 3-6 months, BTC will remain below the resistance line.
Altcoins News
- 🌖 Do Kwon, founder Terraform Labs, released the “Terra Ecosystem Revival Plan”: This is a plan to improve the blockchain Terra, by distributing full ownership of the network to UST and LUNA holders through 1 billion new tokens . This plan comes after the “death spiral” stablecoin Terra, UST, which was supposed to be pegged at $1, dropped to just 15 cents last week. UST’s sister token, LUNA, which serves to prop up UST’s value, fell to just under a penny (LUNA was in the $80 price range a week before it fell).
- 💵 Compound Treasury receives a credit rating of B- from S&P Global: Compound Treasury is a decentralized finance (DeFi) platform by Compound Labs that allows investors to earn 4% returns on deposits in stablecoins such as USDC. On Monday, Compound Treasury became the first decentralized lending platform to receive a rating from a major credit agency, S&P Global. S&P Global rates Compound Treasury with a B- rating on a “highly speculative” note. Although the ranking is not in the highest position, this can be interpreted as legitimacy to the decentralized lending protocol.
Other Important News From The Crypto World
- ✈ Emirates will accept payments with BTC: Emirates, the largest airline in the United Arab Emirates (UAE), announced that it has plans to implement Bitcoin (BTC) payments and launch non-fungible tokens (NFT) for trading via the company website. In a media meeting held at Arabian Travel Market, Emirates chief operating officer, Adel Ahmed Al-Redha stated that the airline will recruit new employees who will focus on blockchain-related projects such as crypto payments, blockchain tracking, metaverse, and NFT.
- 🚀 Goldman, Barclays Invest Crypto Trading Platform: Goldman Sachs Group Inc. and Barclays Plc joined in a $70 million fundraising round of Elwood Technologies LLP, the cryptocurrency trading platform created by billionaire Alan Howard.
Reference
- Guillermo Aviles, Weekly Recap May 13, Messari, accessed on 16 Mei 2022
- Sam Kessler, Do Kwon’s Proposed Terra ‘Revival’ Puts UST, LUNA Holders in Charge, CoinDesk, accessed on 16 Mei 2022
- Zhiyuan Sun, Compound Treasury receives B- credit rating from S&P Global Ratings, Cointelegraph, accessed on 16 Mei 2022
- Ezra Reguera, Bitcoin to the sky: Emirates to accept BTC payments and launch NFT collectibles, Cointelegraph, accessed on 16 Mei 2022
- The Investopedia Team, Golden Cross vs. Death Cross: What’s the Difference?, Investopedia, accessed on 16 Mei 2022
- Yueqi Yang dan Anchalee Worrachate, Goldman, Barclays Invest in Alan Howard Crypto Trading Platform, Bloomberg, accessed on 16 Mei 2022
Share


