Market Analysis October 24-30: Positive Q3 Earnings, Bitcoin and ETH Increase

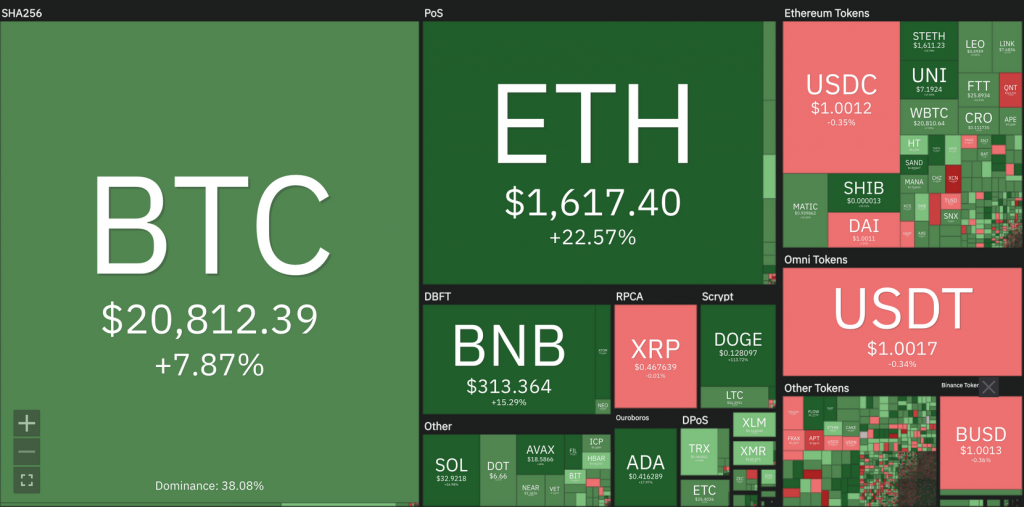
The strong Q3 earnings positively impacted the crypto market. BTC and ETH prices have increased by 7% and almost 20%, respectively, over the last week.
This crypto market analysis will provide you with various data regarding the movement of the crypto market. This data can help you see the meaning behind the movement of BTC and ETH over the past week. Apart from that, there are several important news from the crypto market that you should know about. Always remember that the goal of this weekly Market Analysis is to provide information and education, not financial advice.
block-heading joli-heading" id="market-analysis-summary">Market Analysis Summary
- 📈 Positive Q3 earnings had made both capital and crypto market shine this week, with the majority of the indexes rising.
- 💡 BTC price level coincides with the 250 weeks MA (at 20,500), which is historically been a very strong support after breaking down from the 200 weeks MA support.
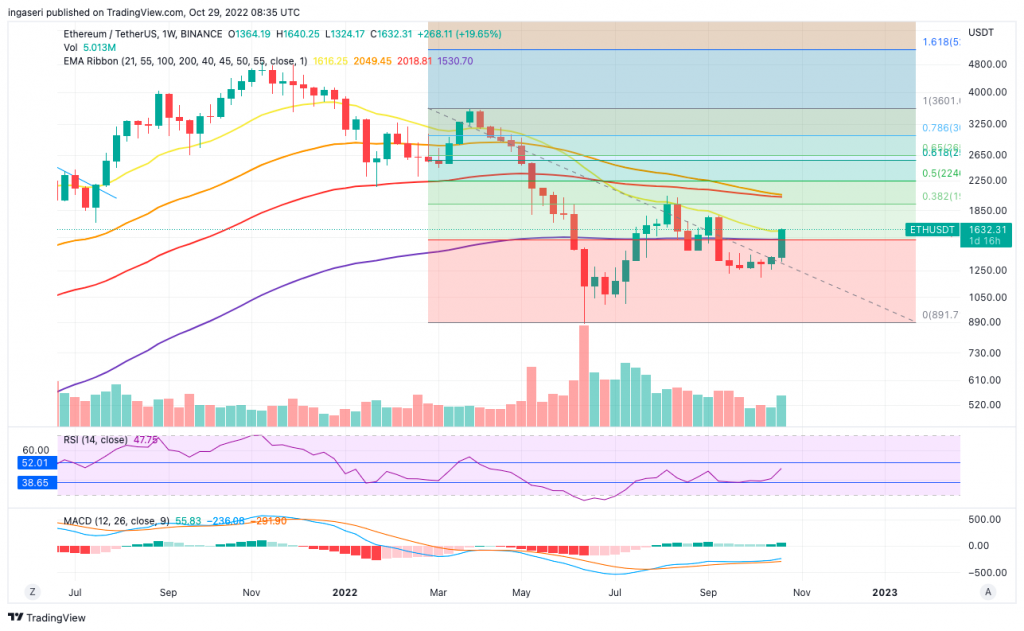
- ✨ ETH has been seeing a very strong week, gaining almost 20% WoW. It has blasted through the 0.236 Fibonacci retracement as well as the 100 and 200 week EMA.
Macroeconomy Analysis
Positive Q3 earnings had made both capital and crypto market shine this week, with the majority of the indexes rising. S&P earnings are currently tracking to more than 2% YoY increase. Energy sector earnings increased ahead of healthcare and now generating the biggest upside among the sectors at 12% vs 7% for healthcare.

As discussed for the past few months, the case of both the equity and crypto market bottoming out and reversing its downtrend momentum depends on how the economy responds to the monetary policy adjustment from your unconventional quantitative easing stance to a tightening stance.
The bearish case for markets continues to depend on the fact that the widely unexpected rebound in inflation over the past year has forced major banks across the world to pivot sharply from their easy monetary stance to that of tightening one, which is aimed at curbing and bringing inflation down.
Looking ahead, there’s a likelihood that markets continue their bearish stance since abrupt monetary policy reversal is likely to cause a recession, which will continue to depress valuation multiple and earnings. In this particular scenario, there will be continuing collateral damage to the global economy and financial markets.
In the bullish scenario, we would have thought that all of the bubbles will have burst already. Monetary policy has turned restrictive enough that inflation is brought down without causing a global recession. We will need to see as Fed will likely increase its rate two more times before the end of 2022.
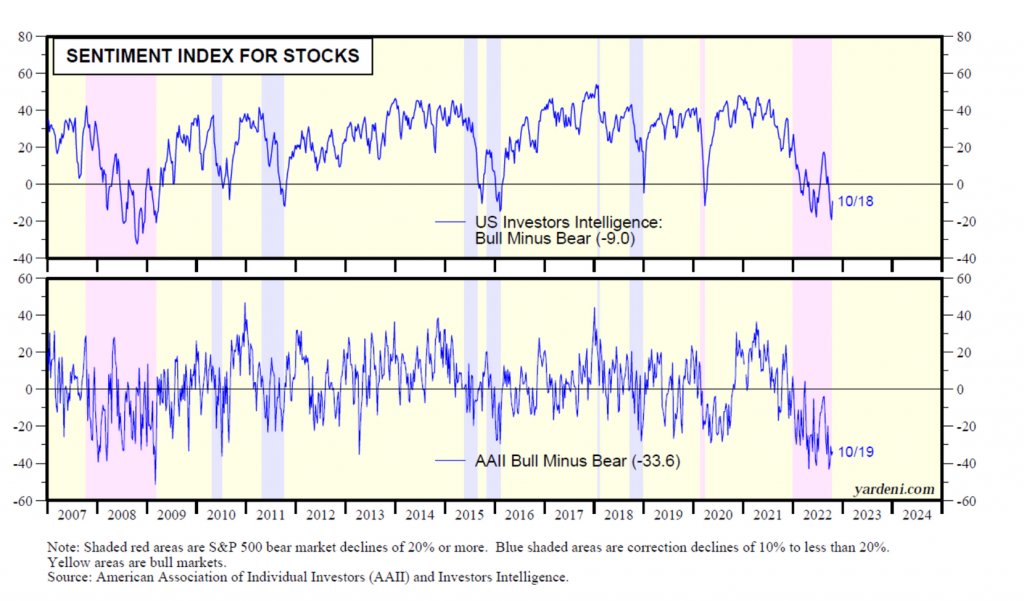
Needless to say, the bearish case seems to triumph over the bullish case for now. The spread between bull and bear in the US Investor Intelligence Survey is -9.0 and -33.6 according to AAII.
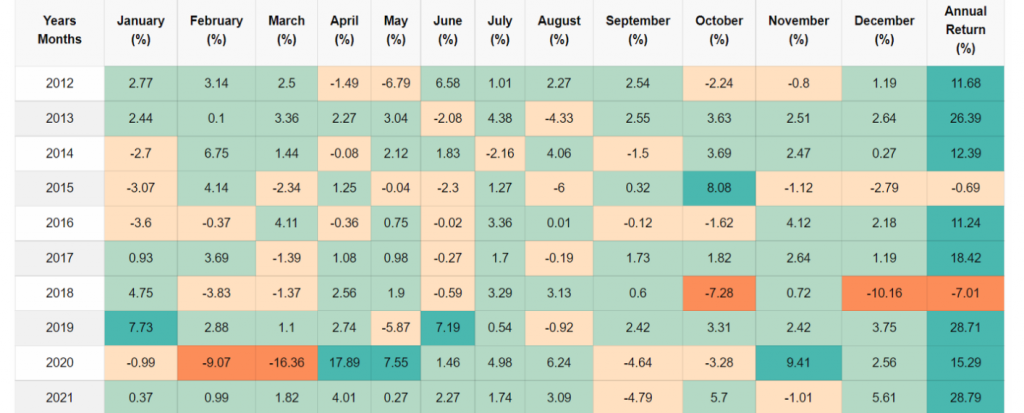
Favoring the bulls throughout the end of the year is the typical Christmas rally. This is then coupled with the midterm elections that are happening in early November. Below is the chart for the monthly historical return for the S&P500 index. Since 1928, the S&P 500 fell 1.1% on average during September, by far the worst performance of any month. October, November, and December were up 0.5%, 0.6%, and 1.4% on average.
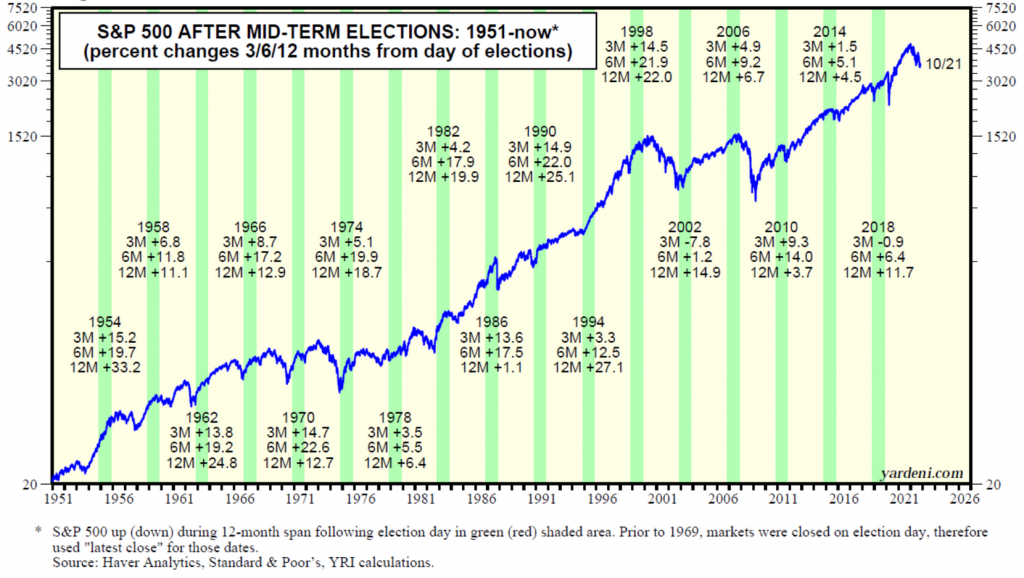
Since 1942, during each of the 3-month, 6-month, and 12-month periods following each of the 20 midterm elections, the S&P 500 was up on average by 7.6%, 14.1%, and 14.9%. Expect to see more favorable market conditions in the coming months due to the midterm phenomenon coupled with the Christmas rally.
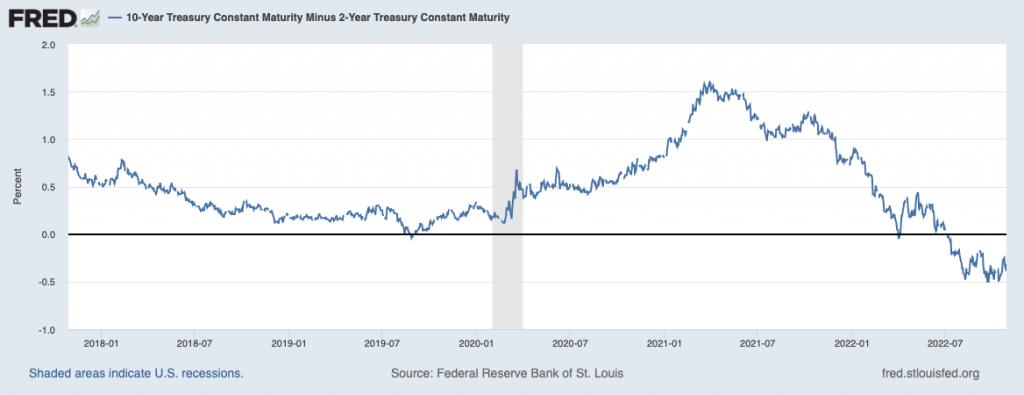
Notice that the yield curve spread has slighty decreased to -0.39 (from -0.5 mid-October). The Dollar Index seems to be having its 2nd consecutive weekly red candle. Falling US Treasury yields and DXY could potentially relieve the selling pressure hitting the equity indexes following big tech earnings.
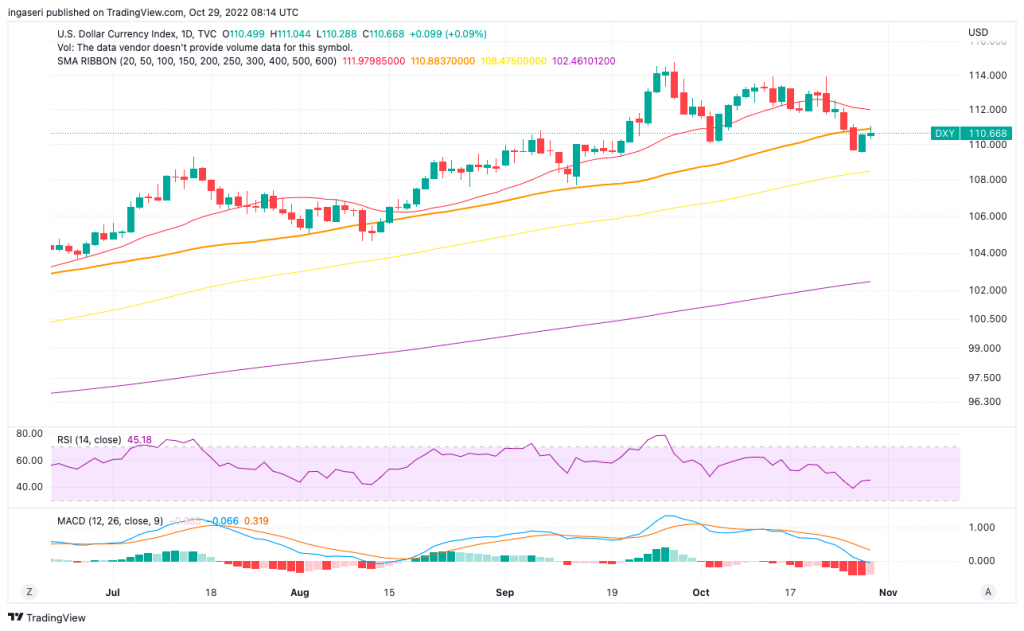
US Dollar Chart Movement
On global news, We saw Rishi Sunak appointed as the 57th Prime Minister of United Kingdom. Following the announcement, we see the British Pound rallied against US Dollar.
Mid week, the European Central bank raised their rates by 75bps to 1.5% for the 3rd consecutive time, putting the reduction of its balance sheet on the agenda. ECB rates had been negative for eight years until it hiked in mid 2022.
We also saw Xi JinPing re-election in China, becoming the first president to be elected for a third term in the history of the country. This shocked the financial markets with the Chinese stocks having their worst day since Covid crash. This occurs amid country’s Q3 GDP report revealing a stronger than forecast growth figure. The Chinese Yuan also dropped to a new all time low vs the USD.
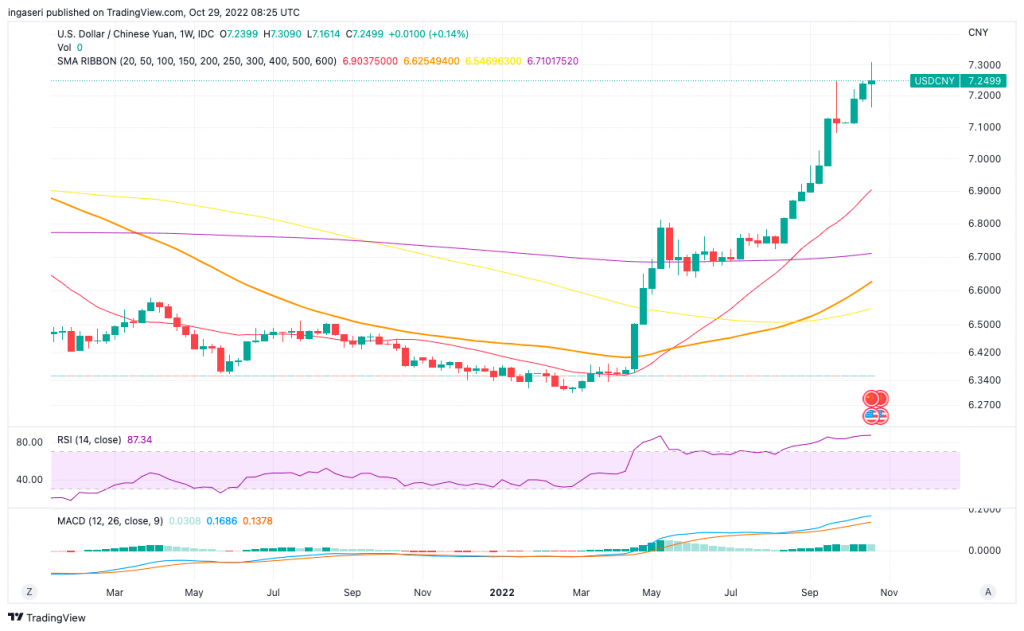
Week Ahead
The following economic data and potentially market-moving events are slated for the week ahead:
- Tuesday:
- Total light vehicle sales in October 2022 by Bureau of Economic Analysis.
- Job Opening and Labor Turnover Survey Report in September 2022 by U.S. Bureau of Labor Statistic.
- Manufacturing Report in October 2022 by Institute of Supply Management (ISM).
- Markit Purchasing Managers’ Index Report in October 2022 and construction spending in September 2022.
- Wednesday:
- Federal Open Market Committee Meeting
- ADP Employment Survey (a monthly report on the U.S. nonfarm private sector employment)
Some other data such as the Purchasing Managers’ Index Composite and Markit Purchasing Managers Composite Services for October 2022, as well as the employment report will also be released next week. Also, more than 100 companies are expected to report their Q3 earnings.
Monitoring the data above is an important thing to do as a reference for macroeconomic conditions and can affect market movements.
Bitcoin Price Movement 24-30 October 2022
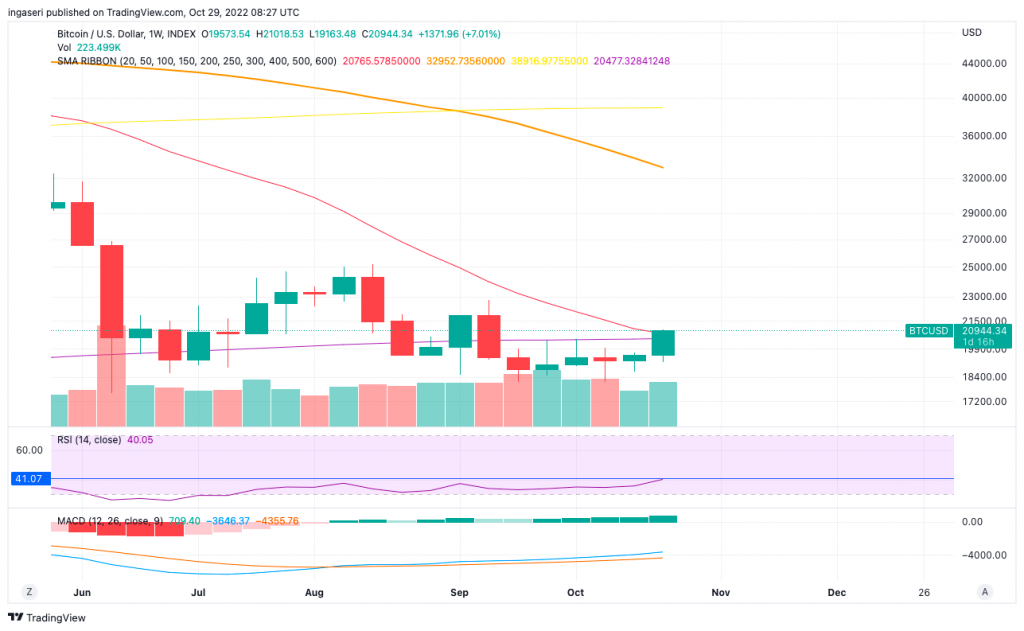
Over the past week, we have seen that BTC rose 7% (at the time of this writing). Note that the current price level coincides with the 250 weeks MA (at 20,500), which is historically been a very strong support after breaking down from the 200 weeks MA support. Should we close above the price point, expect more upside in this rally.
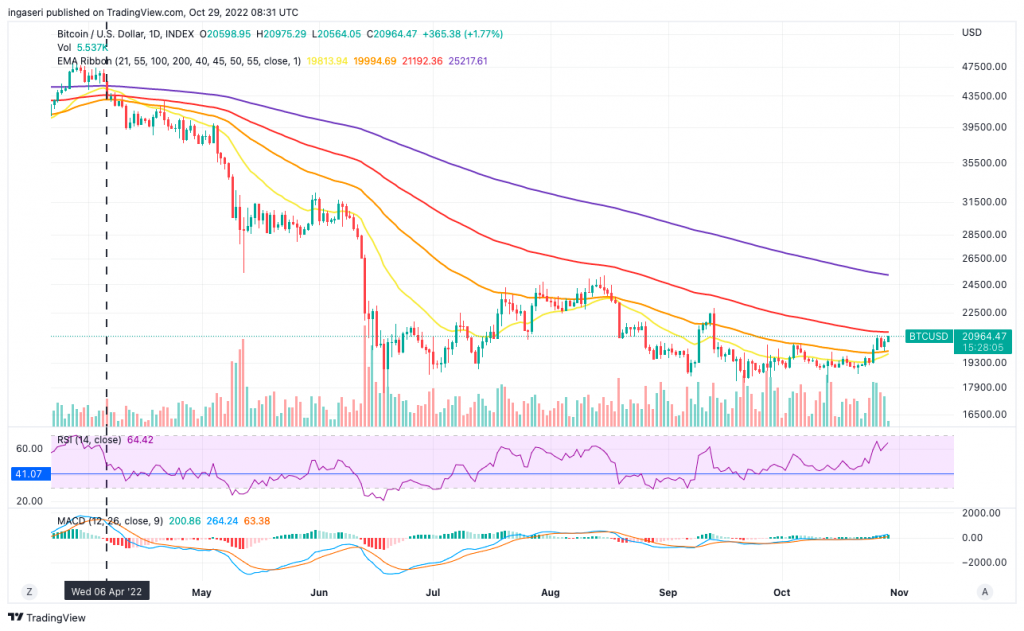
On shorter term view, BTC is trying to break above the 55 weeks EMA ( at 21,200). Last we broke down from this support line was back in April, we have yet to see whether we are able to break this resistance. We have tried 4 times since April to break through this resistance but to no avail. This is a very important price point to develop positive momentum towards the upside.
Ethereum Price Movement 24-30 October 2022
ETH has been seeing a very strong week, gaining almost 20% WoW at this time of writing. It has blasted through the 0.236 Fibonacci retracement as well as the 100 and 200 week EMA. A very strong positive momentum indeed throughout the week. Next resistance would be the range of 1720-1740, which coincide with the daily Fibonacci golden pocket. Support is at 1617.
On-chain Analysis:
- 📊 Exchanges: As the exchange reserve continues to fall, it indicates lower selling pressure. Net deposits on exchanges are high compared to the 7-day average. Higher deposits can be interpreted as higher selling pressure.
- 💻 Miners: Miners’ are selling holdings in a moderate range compared to its one-year average. Miner’s revenue is in a moderate range, compared to its one-year average.
- 🔗 On-Chain: More investors are selling at a loss. In the middle of a bear market, it can indicate a market bottom. Long term holders’ movement in the last 7days were lower than the average. They have a motive to hold their coins. Investors are in a capitulation phase where they are currently facing unrealized losses. It indicates the decreasing motive to realize loss which leads to a decrease in sell pressure.
- 🏢 Derivatives: Short position traders are dominant and are willing to pay long traders. Buying sentiment is dominant in the derivatives market. More buy orders are filled by takers. As OI increases, it indicates more liquidity, volatility, and attention are coming into the derivative market. The increasing trend in OI could support the current ongoing price trend.
- 📈 Technicals: RSI indicates an overbought condition where 70.00% of price movement in the last 2 weeks have been up and a trend reversal can occur. Stochastic indicates a neutral condition where the current price is in a moderate location between the highest-lowest range of the last 2 weeks.
Altcoin News
- 🐶 Dogecoin soars as Elon Musk officially buys Twitter: Tesla CEO Elon Musk bought Twitter for $44 million last Thursday. Dogecoin, Elon Musk’s ‘favorite cryptocurrency,’ jumped in response to the news. The price of Dogecoin reached USD 0.1397 on October 30, up 86.02% from Thursday, becoming the highest price in the last five months.
More News from Crypto World in the Last Week
- 🏦 Twitter allows buying and selling of NFT: Twitter will allow its users to display NFT in their Tweets. This feature, called NFT Tweet Tiles, will display NFT collections in a special panel on Tweets, including buy and sell NFT buttons. Twitter partners with marketplaces Magic Eden, Rarible, Dapper Labs and Jump.trade.
- 🏹 Robinhood adds Tezoz and Aave coins: Robinhood, a crypto asset trading app, adds two new coins: Tezoz and Aave. Tezoz is a blockchain network with a proof-of-stake consensus mechanism, while Aave is a decentralized crypto asset lending application. Both coins have a total market cap of 1 US dollar.
- 🏴 The UK is poised to become the crypto center of the world: Rishi Sunak, known as a ‘crypto-friendly’ person, has officially become the Prime Minister of the UK. As a Prime Minister of UK, he positively responded to the UK crypto industry as he unveiled plans to turn the UK into a hub for crypto technology and investment worldwide. This move is expected to be good news for the cryptocurrency market and the economy in general.
Cryptocurrencies Market Price Over the Past Week
Cryptocurrencies with the Best Performance
- Dogecoin (DOGE) +117.43%
- Klaytn (KLAY) +96.47%
- Mina (MINA) +27.51%
- Shiba Inu (SHIB) +26.83%
Cryptocurrencies with the Worst Performance
- Aptos (APT) -21.26%
- Chain (XCN) -14.02%
- Casper (CSPR) -10.17%
- Quant (QNT) -7.28%
References
- Andrew Hayward, Twitter Will Allow Users to Buy and Sell NFTs Through Tweets, Decrypt, accessed 28 Oktober 2022.
- Alys Key, Robinhood Adds Aave and Tezos, Decrypt, accessed 28 Oktober 2022.
- Camomile Shumba, Crypto-Friendly Rishi Sunak to Become UK Prime Minister Following Truss Exit, Coindesk, accessed 28 Oktober 2022.
Share


