What is Doji Candle and How To Use It in Trading

Understanding candlestick patterns is crucial to learning about market dynamics and making the right decisions in trading. Among the most intriguing and frequently discussed patterns is the doji candle. This pattern resembles a cross with a long wick and a tiny body providing valuable information about price movements. These range from market uncertainty to potential trend reversals. So, what does the doji candle pattern look like, and how can traders utilize it in their strategies? Find out in the following article.
Article Summary
- 📊 Doji candle is a candlestick pattern with almost equal opening and closing prices. The result is a small body with a long wick that signals uncertainty in the market.
- ✨ There are three types of doji candles: gravestone doji (bearish signal), long-legged doji (consolidation signal), and dragonfly doji (bullish signal).
- 🔬 In trading, doji candles can indicate a potential trend reversal if they occur at the end of a bearish or bullish trend. However, it cannot be used as a single indicator and should be combined with other indicators.
- ⚠️ Some limitations of doji candles are that they are rare, can give false signals, don’t show price targets, and are quite tricky to interpret.
What is Candle Doji?
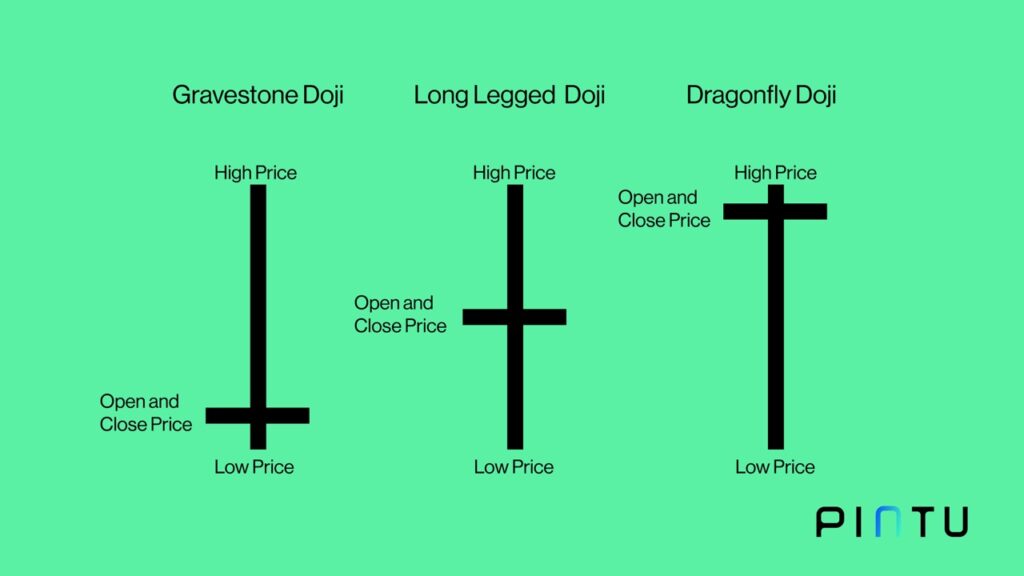
A doji candle is a candlestick pattern that forms when an asset’s opening and closing prices are almost equal. This results in a candle with a tiny body but a long wick. In shape, doji candles can look like crosses, inverted crosses, and plus signs.
The appearance of doji candles is often associated with indecisive market conditions. This is reflected by the absence of a more dominant buyer or seller during the trading period.
However, doji candles can also be used to identify potential trend reversals. For example, if a doji candle forms at the end of a downtrend, it signals a trend reversal to bullish could occur. And vice versa.
Doji candles that form at support or resistance areas provide more reliable signals. This is because buyers or sellers are most likely to make transactions in these areas. For example, when an asset is in a support area, there will most likely be a buying action that prevents the price from falling further. The buying action can then trigger the price to rise. That’s why doji candles can also be used to identify trend reversals.
Learn how to read various candlestick patterns through this Pintu Academy article.
Type of Doji Candle

- 🪦 Gravestone Doji. This doji candle has a long wick upwards with a tiny body at the bottom, resembling an inverted cross. This type of doji signals a potential downtrend. It’s because the asset’s price attempts to break through a new high, but in reality, the sell-off is more dominant. Resulting in the price being further down. The long upward wick represents an upward price trend that is losing momentum.
- 👣 Long-Legged Doji. This doji candle has equally long upper and lower wicks with a small body in the middle. Long-legged doji indicates a neutral or consolidation signal. This is because neither buyers nor sellers have the upper hand during the trading period.
- 🐉 Dragonfly Doji. This doji candle is the opposite of the gravestone doji, with a long wick downwards and a tiny body at the top. It looks like the sign of the cross. It shows that sellers were quite dominant at the beginning of the period, but buyers were more dominant by the end of the trading session. It was pushing the price towards the opening price. The high buying pressure during a downtrend suggests a potential trend reversal.
How to Read Doji Candle Pattern
Doji candle are generally more of an indicator that shows that the current price is “neutral”. Do not make the wrong decision because the market is in a state of “wait and see” when a new doji is formed.
So, it would be best if you did not rush to interpret that the appearance of a doji candlestick will indicate a trend reversal. However, certain types of doji candles give stronger signals when combined with other technical indicators.
To get stronger doji candle signals, consider the market conditions' overall trend. It will give more accurate trend reversal signals if it forms at the end of an uptrend or downtrend.
In addition, the length of the wicks on the dragonfly and gravestone doji can be an early signal of a trend change, as described above. The longer the wick, the stronger the trend reversal signal. However, doji candles still cannot stand independently. It would be best to have a new candle or another technical indicator to determine the buy and stop loss points.

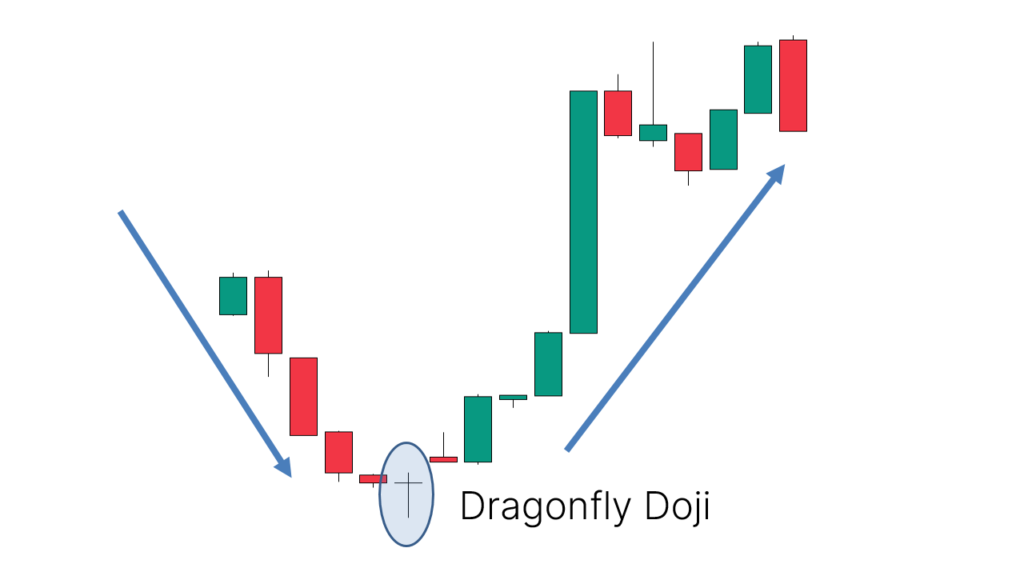
As seen in the illustration above, there is a dragonfly doji at the end of a downtrend. Afterward, a candle shows the price is still trying to rise even though the closing price is below the opening price. The candle can confirm that a bullish trend is likely to occur. Evidently, after that, the price moved up.
How to Use Doji Candle for Trading
Here’s how to use doji candles for trading:
- 🌀 Identifying trend reversals.
One of the primary uses of doji candles is to look for trend-reversal signals. So, if a trader finds a doji candle at the end of a bearish trend, it could be a bullish trend reversal signal. Meanwhile, if a doji candle forms at the end of a bullish trend, then there’s a chance that the trend will reverse.
Don’t stick to just one doji candle to get a better signal. Wait for the next candle or combine it with other technical indicators to confirm that a trend reversal is likely to occur.
- ☑️ Confirming signals of other technical indicators.
Doji candles can also be used to confirm signals from other technical indicators. For example, to confirm support and resistance levels.
If a doji candle forms in key support areas, it could signal that the support level will hold and a bullish trend reversal is possible. Thus, traders can place buy orders slightly above the highest price of the doji candle. Then, to limit risk, traders can put a stop loss slightly below the lowest price of the doji candle.
Meanwhile, the level will hold if it forms at key resistance areas, and a bearish trend reversal will occur. Therefore, traders can place a sell order below the lowest price of the doji candle.
Gunakan limit order untuk memasang buy dan sell order ataupun stop loss. Pintu Academy sudah menyiapkan panduannya di sini.
Weakness of Doji Candle
For traders who want to use doji candles, it is important to be aware of the following limitations:
- 🚫 Potential for False Signals: Just like any other technical indicator, doji candles are not foolproof and can occasionally produce false signals.
- 🔎 Rare Occurrence: Doji candles are relatively uncommon, which can make them challenging to identify and utilize effectively.
- 🎯 Doesn’t show price targets: Doji candles can identify potential trend reversals but don’t show price targets.
- 💭 Interpretation Complexity: Doji candles can be interpreted in several ways, making them quite difficult to interpret and use as a trading reference.
Conclusion
A doji candle is a candlestick pattern that forms when an asset’s opening and closing prices are almost equal—making it have a small body with a long wick. This pattern is often associated with uncertainty in the market, but it can also be used as a sign of a potential trend reversal. There are three main types of doji candles: gravestone doji, which signals a bearish signal; long-legged doji, which indicates consolidation; and dragonfly doji, which gives a bullish signal.
While dojis can indicate price movements, they should not be used as a sole indicator. Using it with other technical indicators to confirm the signal is better. In addition, consider the trend of market conditions when you want to use doji candlesticks. Make sure it also forms when at the end of a bearish or bullish trend.
Here’s an article that can help you understand the difference between bull and bear markets.
Buy Crypto Assets on Pintu
Looking to invest in crypto assets? No worries, you can safely and conveniently purchase a wide range of cryptocurrencies such as BTC, ETH, SOL, and others safely and easily on Pintu. Pintu diligently evaluates all its crypto assets, highlighting the significance of being cautious.
Pintu is also compatible with popular wallets such as Metamask to facilitate your transactions. Download Pintu app on Play Store and App Store! Your security is guaranteed because Pintu is regulated and supervised by Bappebti and Kominfo.
Aside from buying and trading crypto assets, you can expand your knowledge about cryptocurrencies through various Pintu Academy articles. Updated weekly, all Pintu Academy articles are made for knowledge and educational purposes, not as financial advice
References
Jamen Chen, What Is a Doji Candle Pattern, and What Does It Tell You? Investopedia, accessed on pada 10 October 2023.
Richard Snow, How to Trade the Doji Candlestick Pattern, Daily FX, accessed on pada 10 October 2023
Yashu Gola, What is a Doji candle pattern and how to trade with it? Coin Telegraph, accessed on pada 10 October 2023.
Share


