Mastering Wyckoff Patterns: The Smart Money’s Approach to Trading
Wyckoff Pattern is a popular indicator used by traders to identify market trends. The theory analyzes price trend movements based on four phases: accumulation, uptrend, distribution, and downtrend. Using the Wyckoff Pattern, traders can identify the most opportune moments to buy and sell an asset. Intrigued to delve deeper into Wyckoff Pattern and its applications? Find out in the following article.
Article Summary
- 📊 Wyckoff Pattern is a theory developed by Richard Demille Wyckoff. He observes and understands market dynamics and investor behaviour, especially institutional (smart money).
- 💡 There are three fundamental principles in the Wyckoff Pattern: supply and demand dynamics, market manipulation, and the role of institutional investors.
- 🌟 The Wyckoff Pattern has four phases: accumulation, markup/uptrend, distribution, and markdown/downtrend.
- 🏆 Four important indicators to determine the breakout in the Wyckoff Pattern are spring or shakeout, trading volume, price action, and backing up action.
What is Wyckoff Pattern?
The Wyckoff Pattern is a widely used technical analysis method for predicting the asset’s price direction, including cryptocurrency. Richard Demille Wyckoff developed this method in the 1930s. By using the Wyckoff Pattern as an analysis tool, traders can identify trend reversals or breakouts.
The Wyckoff Pattern is a technical analysis method that involves a price movement chart, trading volume, and other trading information to make analysis and buying and selling decisions. Its approach consists of observing and understanding market dynamics and investor behaviour.
Three fundamental principles form the basis of the Wyckoff Pattern:
- ⚖️ Supply and Demand Dynamics. The Wyckoff Pattern views the market are driven by the interaction between buyers and sellers. If there is an imbalance between supply and demand, it can lead to significant price movements.
- 🔄 Market Manipulation. The Wyckoff Pattern assumes that institutional investors and market makers manipulate the market to accumulate or distribute assets. Understanding this manipulation movement can help traders identify important turning points in the market.
- 🏦 Role of Institutional Investors. Institutional investors and whales, often called “smart money,” play a significant role in market movements. The Wyckoff Pattern focuses on analyzing the actions of smart money to gain insights into future price trends.
Wyckoff Pattern Phase
The Wyckoff Pattern consists of four main phases: accumulation, uptrend, distribution, and downtrend. The following is an explanation of each phase:
Accumulation Phase
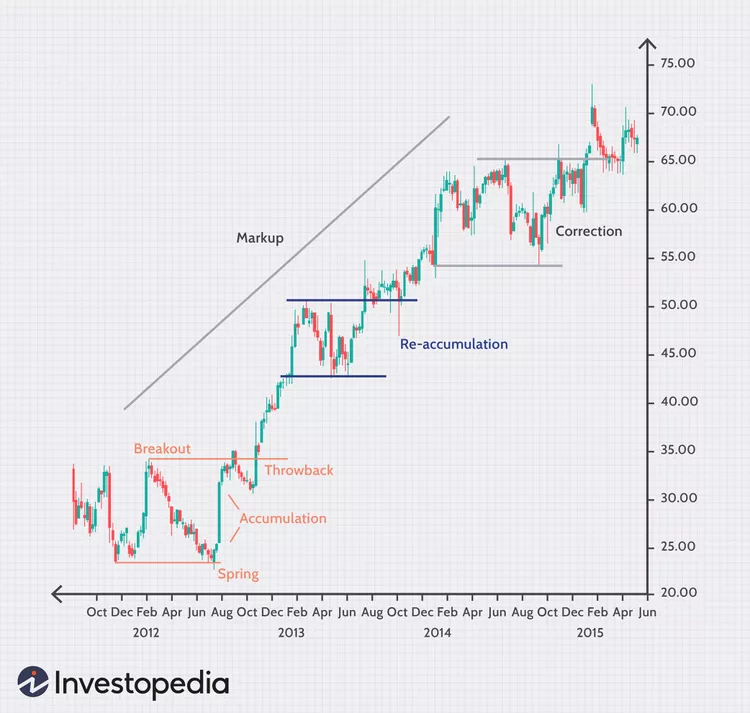
Every price cycle begins with an accumulation phase, which creates a trading range. This phase is marked by a market bottom or a market condition where the price experiences a reversal from a downtrend to an uptrend. Although a reversal occurs, the price tends to move sideways during this phase.
As the price moves sideways, there will be no specific trend so that the price will fluctuate at support and resistance levels. As the name suggests, traders can start accumulating assets gradually during this phase.
Markup or Uptrend Phase
The Markup Phase follows the Accumulation Phase or an uptrend when a breakout occurs and a new uptrend is formed. In the Wyckoff pattern, there’s a term called throwbacks, which refers to a pullback pattern after a breakout. Throwbacks that form new support offer an opportunity to add to buying positions.
Generally, a consolidation pattern called a reaccumulation zone is created in the middle of the uptrend. Additionally, there’s a deeper pullback pattern, which in the Wyckoff Pattern is called a correction. The Markup Phase, or uptrend, is considered to end when the price fails to reach new higher highs after the correction.
Distribution Phase
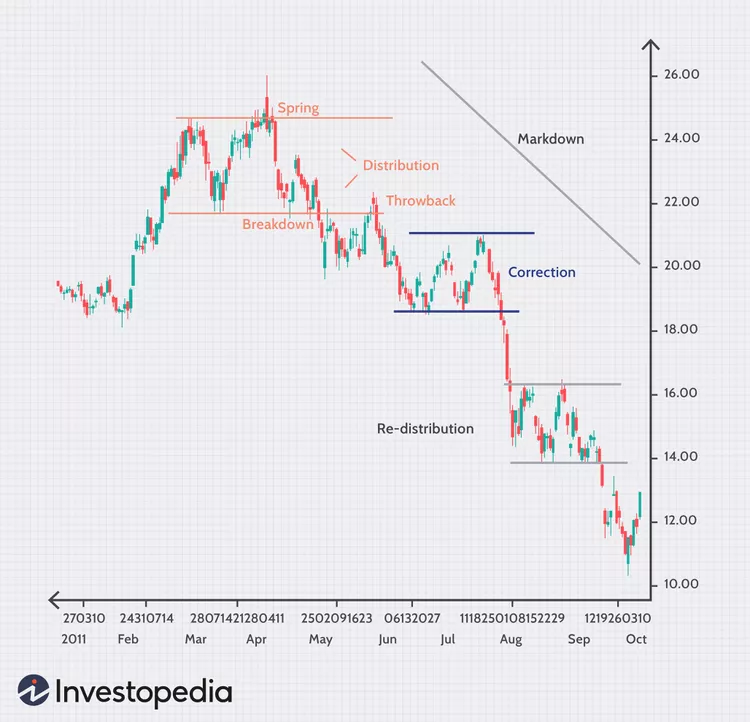
The failure to create new higher highs in the Markup Phase marks the beginning of the Distribution Phase. In terms of pattern and trend, the Distribution Phase is similar to the Accumulation Phase because the price moves within a limited range. The difference lies in the position of smart money, which starts to take profits and exit the market.
Instead, investors or traders who enter later will determine the continuation of the trend. As long as the number of buyers can balance the number of sellers, the Distribution Phase can last longer. However, when the price finally breaks down and fails to create a higher low, it signifies the end of this phase.
Markdown or Downtrend Phas
The formation of lower highs and lower lows marks the beginning of the Markdown Phase or downtrend. Similar to the Markup Phase, this phase will create a throwback when the price rebounds and creates new resistance. This can be the best area to take profit or completely cut losses from the market.
For futures traders, the throwback point can be used as an entry point for shorting
A consolidation pattern called a redistribution zone will also be created in the middle of the downtrend phase. This phase is created because many new buyers enter when the price corrects, but ultimately, they will quickly sell their assets. The downtrend phase ends when the selling pressure subsides, and the asset begins its market bottom.
Analyzing the Wyckoff Accumulation Process
A crucial aspect of using the Wyckoff Pattern is identifying the breakout point within the Accumulation Phase. As previously mentioned, this breakout validates the completion of the Accumulation Phase and marks the beginning of a significant price upswing.
Here are the key indicators to confirm a breakout:
- Spring or Shakeout. Before a breakout occurs, the price typically retests the support level within the trading range for the final time. This event is known as a spring or shakeout. During this test, the price often experiences a sharp decline, eliminating weak hands and establishing a solid foundation for the uptrend.
- Volume Confirmation. A breakout should be accompanied by a significant increase in trading volume. Rising volume validates the breakout as it indicates growing demand. Lower volume during pullbacks can be a positive sign, suggesting that smart money supports higher prices.
- Price Confirmation. A breakout should also exhibit strong price action momentum above the resistance level. Traders can utilize additional technical analysis tools like trendlines and moving averages to confirm the strength of the breakout.
- Backing Up Action. Ideally, after the breakout, there should be a “backing up action” where the price is retraced to test the breakout level, which has now become support. If the breakout level successfully holds as support, it reinforces the bullish trend and confirms the reliability of the breakout.
Strategies to Use the Wyckoff Pattern
The Wyckoff Pattern offers a valuable framework for identifying potential trading opportunities. To effectively utilize this pattern, consider implementing the following strategies:
- 🔎 Confirm Entry Points. The ideal entry point occurs when a breakout above the resistance level is accompanied by a surge in volume and confirmation of price action. Consider employing additional indicators like moving averages, trendlines, or oscillators to identify such points.
- 💰 Position Sizing and Stop-Loss Placement. When opening a position, ensure the size aligns with your risk tolerance and available capital. Also, place a stop-loss order below the breakout level to mitigate potential losses if the breakout fails.
- ⚠️ Disciplined Profit Taking. Establish a clear profit-taking strategy. Determine profit-taking levels based on key resistance levels, Fibonacci extensions, or price target projections derived from the Wyckoff accumulation pattern. Consider leaving a portion of the asset open to capture further price appreciation potential.
- 👀 Active Monitoring and Adjustment. Traders must continuously monitor and adjust their strategies in response to evolving market conditions. Continuously analyzing trading volume, price action, and overall market structure helps identify signs of weakening or strengthening trends.
- 🦾 Combine with Other Analysis Techniques. As with most technical indicators, the Wyckoff Pattern should not be used in isolation. Combining it with other indicators can enhance the reliability of the signals obtained. Consider incorporating additional candlestick patterns, trend analysis, or momentum-based indicators.
Conclusion
Traders can use the Wyckoff Pattern to identify market trends and find the most ideal entry and exit points. This identification process is achieved by observing the behavior of smart money, specifically when it accumulates and distributes an asset. By following smart money behavior, traders can achieve significant profit potential.
The most important element in using the Wyckoff Pattern is identifying areas with potential breakouts. Four important indicators determine a breakout: spring or shakeout, trading volume, price action, and backing-up action. However, like other technical indicators, the Wyckoff Pattern becomes more reliable when combined with other technical indicators.
Buy Crypto Assets on Pintu
Looking to invest in crypto assets? No worries, you can safely and conveniently purchase a wide range of cryptocurrencies such as BTC, ETH, SOL, and others safely and easily at Pintu. Pintu diligently evaluates all its crypto assets, highlighting the significance of being cautious.
Pintu is also compatible with popular wallets such as Metamask to facilitate your transactions. Download Pintu app on Play Store and App Store! Your security is guaranteed because Pintu is regulated and supervised by Bappebti and Kominfo.
Aside from buying and trading crypto assets, you can expand your knowledge about cryptocurrencies through various Pintu Academy articles. Updated weekly, all Pintu Academy articles are made for knowledge and educational purposes, not as financial advice.
References
- Dan Ushman, Chart Patterns: Wyckoff Accumulation, Trend Spider, accessed on 11 July 2024.
- Alan Farley, Making Money the Wyckoff Way, Investopedia, accessed on 11 July 2024.
- Wyckoff Analytics, Wyckoff Method, accessed on 11 July 2024.
Share
