3 Important Things Crypto Investors Need to Pay Attention to in April 2026!
Jakarta, Pintu News – The first quarter of 2026 has been a very turbulent period for the crypto market. Bitcoin recorded a 46% drop from its all-time high and a 30% decline since the peak in January.
Ethereum also saw a nearly 50% correction from its record high price. Meanwhile, Solana (SOL), BNB (BNB), XRP (XRP), and a number of other major altcoins also recorded sharp declines from their peak to their low. It is also worth noting that the Fear and Greed index has stayed for 46 consecutive days in the extreme fear zone.
Although geopolitical tensions put immense pressure on growth throughout March, uncertainty regarding Bitcoin’s position as an asset or currency still persists. However, April 2026 is expected to be a turning point that pushes the situation in a more peaceful and neutral direction.
Crypto’s Important Agenda in April 2026
The April crypto calendar contains a number of key catalysts. One of them is the continued discussion of the CLARITY Act, which is expected to go to the Senate Banking Committee in mid-April. On the other hand, the Ethereum (ETH) Glamsterdam upgrade has entered the final stages and is scheduled to launch in June.
Read also: As 40% of Altcoins Approach Their Lowest Levels, These 22 Tokens Still Show Strength!
The AI token category also showed strong growth, with total market capitalization rising 30% in the month, from $14.13 billion to $19 billion combined. In addition, Spot Bitcoin and Spot Ethereum products recorded positive closes, with net inflows in the last 30 days.
Bitcoin and Ethereum Breakout
Bitcoin (BTC) on Tuesday (31/3) moved rather neutrally at the level of $67,821, after throughout March trading in a consolidation range of $65,000 to $72,000. So far, the $72,000 area seems to consistently be a seller’s defense zone, while buyers are starting to actively enter in the range of $65,000 to $67,000.
The logic is quite simple. If the price of Bitcoin manages to break $72,000 and closes weekly above that level, accompanied by positive volume, then the next step is to wait for a retest. If the retest is strong, BTC has the potential to continue rising towards the $78,000 area.
The FOMC meeting agenda on April 28-29 could also be a catalyst for this rally. In fact, if the price scenario occurs before the meeting, the pre-meeting sentiment could also contribute to the upward movement.
Ethereum Outlook Ahead of Glamsterdam Upgrade
On the other hand, Ethereum is still a disappointment for some holders after losing the psychological $3,000 area. ETH is currently trading around $2,043, but still has great potential as the Glamsterdam upgrade approaches. The upgrade is designed to increase the gas limit from 60 million to 200 million and allow for a capacity of up to 10,000 transactions per second. From a technical standpoint, this is a big jump since The Merge upgrade.
Interestingly, ETH prices have historically responded positively to upgrade-related news. The Merge in September 2022 prompted a rally of around 35% in the two months leading up to implementation. The Shanghai upgrade that opened staking withdrawal in April 2023 triggered a rise of almost 40%, while the Dencun upgrade in March 2024 helped Ethereum rise by around 20%.
The pattern shows that bullish reactions usually start forming around 4 to 6 weeks before the day of the event. Currently, Ethereum’s movement is still within the range of $1,900 to $2,100.
With sentiment continuing to grow ahead of the Glamsterdam launch in June, ETH has the opportunity to form a higher high and higher low towards the $2,700 to $2,900 area. However, if the upgrade is delayed until the third quarter, Ethereum risks further pressure and a deeper drop.
AI Tokens Begin to Lead Market Movements

In the last four weeks in the crypto market, the artificial intelligence sector is the only category that still records positive returns.
A number of tokens in this sector have performed notably, such as Bittensor (TAO) which rose 67.5%, Render (RENDER) with a 21% monthly gain, SIREN which shot up 540% in a month, and FET which grew 44.13%. Many other assets in this category also recorded very significant gains.
Along with this trend, the total market capitalization of the AI sector increased to $19 billion and started moving towards the previous capitalization area of around $28 billion.
This phenomenon is actually quite common in crypto market cycles, and has also previously occurred in the memecoin and RWA sectors. In this kind of pattern, the first phase is usually characterized by high rises and large returns, as is currently the case.
After that, the market generally enters a consolidation phase, when the tokens with the highest gains start to correct for about three to four weeks. If the pattern continues, the third phase has the potential to produce even bigger gains than the initial phase.
Therefore, when the prices of AI tokens start to hold their important levels, it is worth paying close attention to. It may not be a sign of prolonged weakness, but rather a consolidation phase that opens up accumulation opportunities.
Meme Coin Has the Potential to Surge
On the other hand, Solana-based meme coins are also showing signs of revival. The weekly trading volume on the DEX for Solana memecoins increased sharply from a low of $40.5 billion in August 2025 to $87.8 billion in the last week of March 2026.
Read also: Hyperliquid Prices Ready to Rebound? HYPE Tests Important Support as Bullish Signals Strengthen
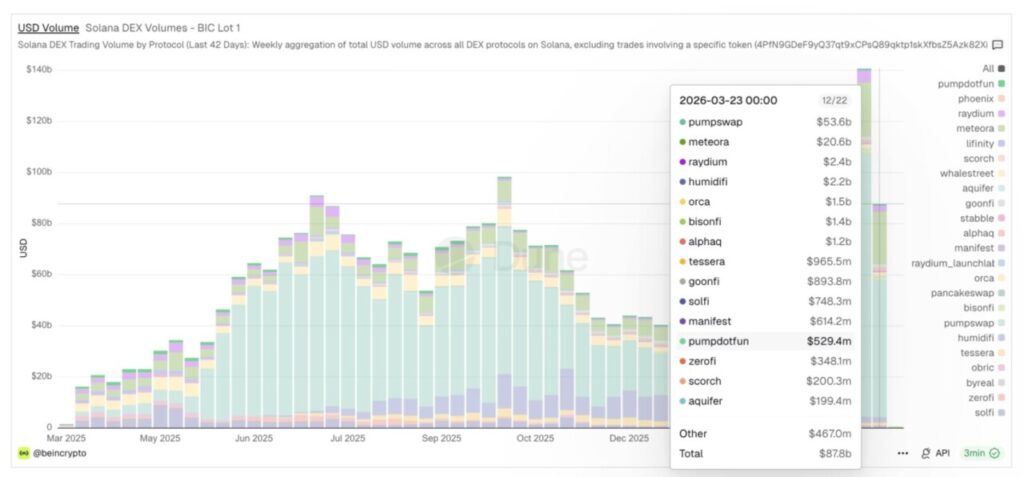
This increase shows that transaction activity in the Solana ecosystem is strengthening again, and the impact is starting to be felt on a number of key tokens such as BONK, PENGU, TRUMP, PIPPIN, CAT, DOG, and POPCAT.
Web3 Token Starts to Prepare to Strengthen
The Web3 token sector is entering an exciting phase on the back of a number of on-chain developments and fundamental catalysts that have the potential to strengthen the prospects of Chainlink (LINK), Polkadot (DOT), Uniswap (UNI), The Graph (GRT), and Internet Computer (ICP).
Chainlink (LINK)
LINK token recorded quarterly growth of 62%, with monthly cross-chain transaction value approaching $18 billion. Major institutions such as JPMorgan and UBS have also begun to actively engage in blockchain-based transaction settlement through Chainlink’s infrastructure.
In addition, the presence of Bitwise Chainlink ETF (CLINK) on NYSE Arca is considered to open up LINK’s exposure to retirement accounts and strategic investment accounts.
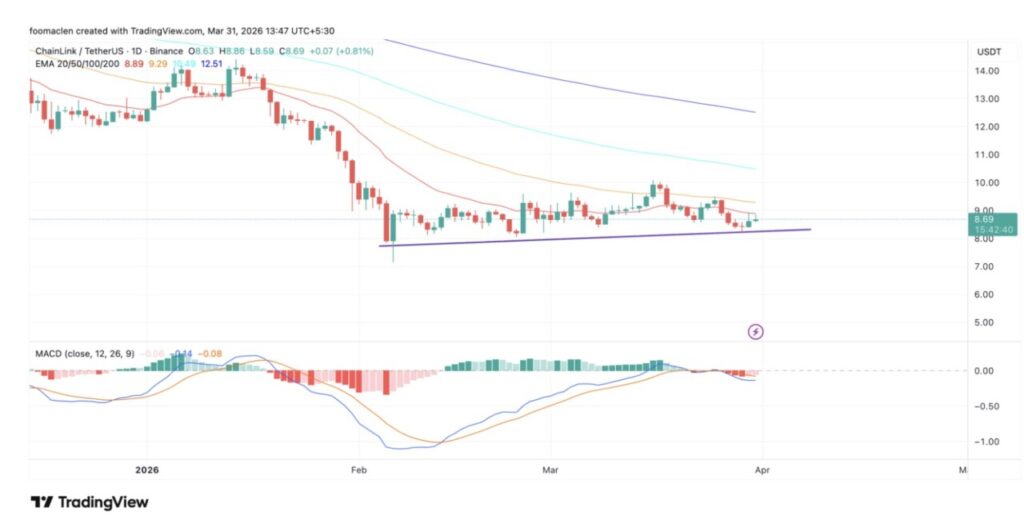
At the end of March 2026, LINK was trading at around $8.69. If you look at the fundamental strength that continues to grow, LINK’s valuation is considered to still have room to push prices to the $25 to $40 area.
Polka dot (DOT)
In early March, Polkadot set a permanent supply limit of 2.1 billion DOT, making the asset deflationary. At the same time, the joint classification of DOT as part of the “digital economy” by the SEC and CFTC has led to its increasingly frequent parallels with Bitcoin and Ethereum.
The next catalyst came from the planned update of the staking mechanism in April, which proposed trimming the unbonding period from 28 days to just 24 to 48 hours. If implemented, this move could potentially increase DOT staking participation.
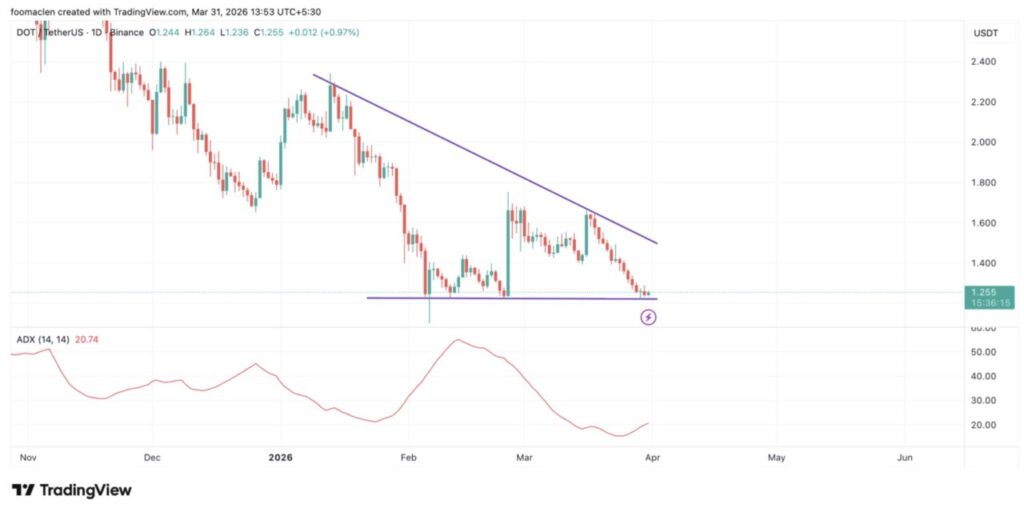
From a technical perspective, the DOT/USDT pair is still moving above the important support area of $1.22, although it continues to face a descending resistance line. The ADX indicator has also started to show a change in momentum to a more bullish direction. For the uptrend to be confirmed, DOT needs to reclaim the area above $1.65, which could then pave the way towards the $2 level.
Uniswap (UNI)
As the largest DEX on the Ethereum network, Uniswap not only supports Ethereum, but has also expanded to various other blockchains while continuously developing its infrastructure.
The latest upgrade, Uniswap V4, brings a number of important features, including the ability for pools to customize fees, on-chain limit orders, and price curves. In addition, the market is also watching the ongoing vote on the distribution of a portion of the protocol fee to UNI stakers.
In the long term, UNI’s price is still far below its record high. However, in the shorter time frame, UNI is still showing a lower low and lower high pattern. Therefore, the price recovery is highly dependent on the influx of positive volumes as well as the market’s growing confidence in the project’s fundamentals.
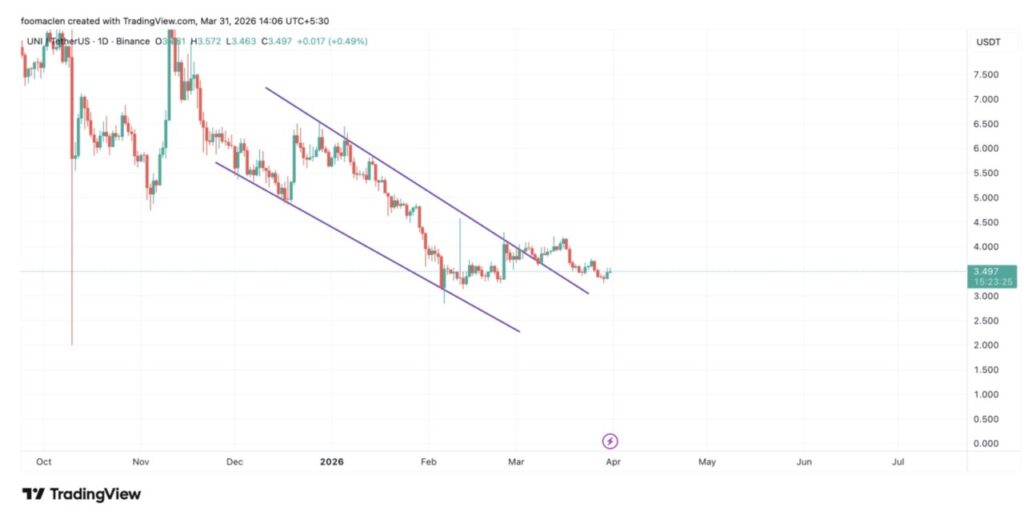
To trigger an upside to the $7 to $9 range, UNI needs a strong daily close above $6. Meanwhile, the immediate support area is around $3.45.
Follow us on Google News to stay up to date with the latest in crypto and blockchain technology. Check Bitcoin price, usdt to idr and tokenized nvidia stock price through Pintu Market.
As a safe crypto app, Pintu provides a crypto trading experience to access crypto gold investment easily and conveniently. You can also see today’ s gold jewelry price and today’s gold bullion price to support your investment activities and portfolio diversification as well as learn crypto through Pintu Academy.
Download the Pintu crypto app via Play Store or App Store now. Enjoy the web trading experience with various advanced trading tools such as pro charting, various types of order types, and portfolio tracker only at Pintu Pro.
*Disclaimer
This content aims to enrich readers’ information. Pintu collects this information from various relevant sources and is not influenced by outside parties. Note that an asset’s past performance does not determine its projected future performance. Crypto trading activities are subject to high risk and volatility, always do your own research and use cold hard cash before investing. All activities of buying and selling Bitcoin and other crypto asset investments are the responsibility of the reader.
Reference:
- Coinpedia. 3 Crypto Things To Do In April 2026. Accessed on April 2, 2026