3 Altcoins Worth Watching in April 2026 Amidst a Volatile Market

Jakarta, Pintu News – The global crypto market capitalization fell significantly again after showing a brief recovery attempt on March 17. As of March 31, it stood at $2.37 trillion, down 2.37% in the last two weeks. This decline was triggered by macro uncertainties related to the ongoing US/Israel/Iran conflict, which continues to suppress investor interest in the digital asset market.
Across assets, institutional investors started to reduce exposure, futures traders tended to go net short, while spot market participants chose to be more cautious and wait for further developments.
With the market expected to be more sluggish, CCN has summarized a number of altcoins worth keeping an eye on in April.
Ethereum: ETF Outflows and Plummeting Interest at CME Reinforce Bearish Signals
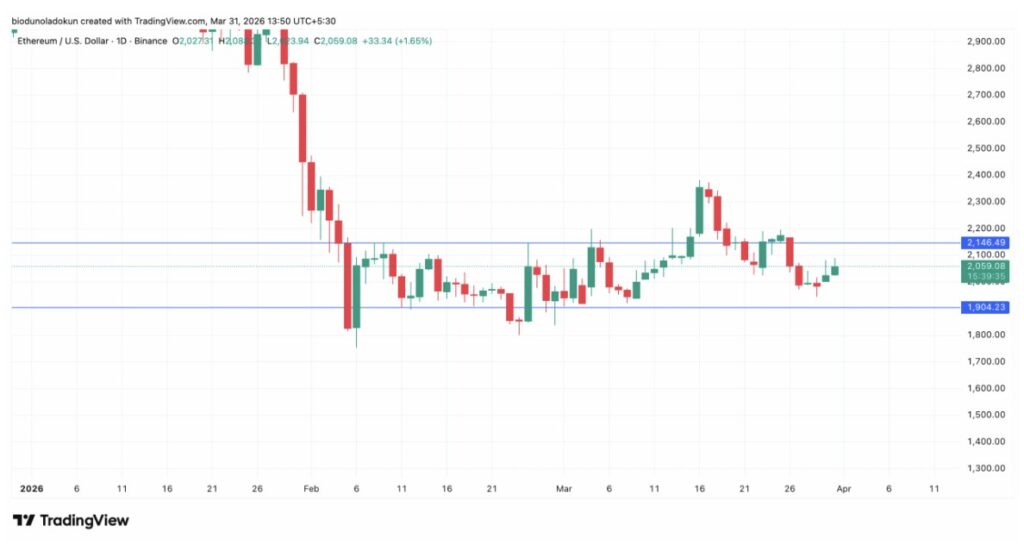
The largest altcoin, Ethereum (ETH), has been moving in a horizontal channel pattern since February 4. Since then, ETH has continued to face strong resistance at the $2,145 level and found support in the $1,904 area.
Read also: Pi Network Releases RPC Server, a Big Step for Application Development?
Despite several attempts to break and stay above the resistance line, ETH’s movement was always under pressure again. The generally weak market performance encouraged market participants to sell whenever the price recorded a slight increase.
These price movements have not been able to rebuild the confidence of institutional investors. Monthly inflows into spot Ethereum ETFs in the US continue to show a downward trend, reflecting weakening interest from large investors.
Based on SoSoValue data, spot ETH ETFs in the US could potentially close the first quarter of 2026 in the negative zone, with March alone recording net outflows of $77.17 million.
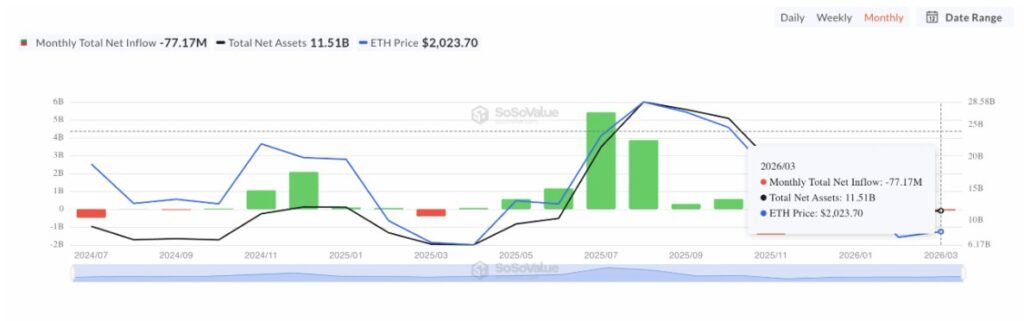
This trend is not new either. These products have seen a steady outflow of capital since August 2025, which has also put pressure on the ETH price. If this continues into April, the price of Ethereum is at risk of falling below $2,000.
In addition, in recent days there has also been a significant decline in the open interest of ETH options contracts on the Chicago Mercantile Exchange (CME).
According to Glassnode, the figure dropped to a 30-day low of $251 million on March 29, from a monthly peak of $730 million recorded on March 18. This means that there has been a decline of about 66% in less than two weeks.
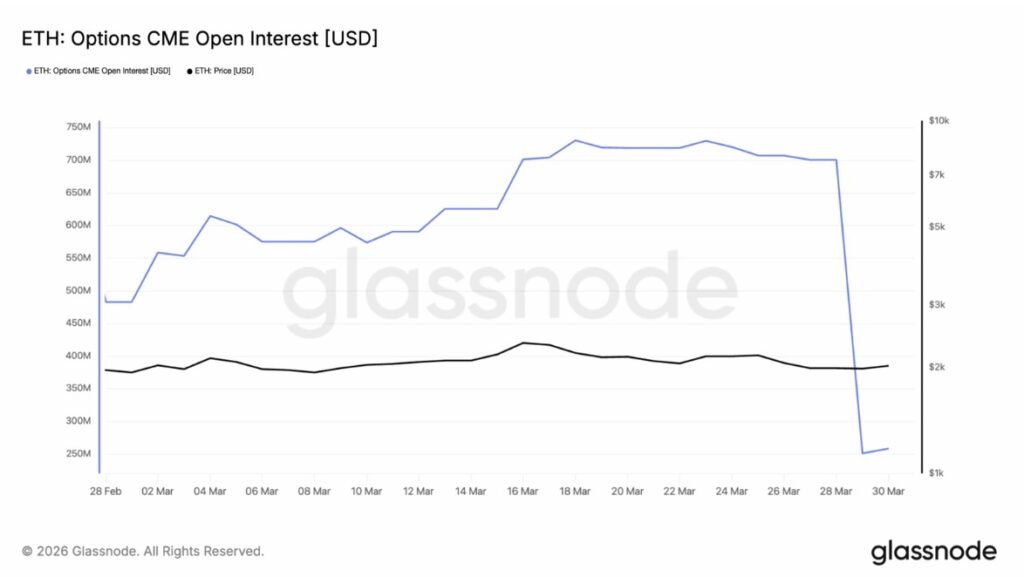
This decline is important to watch as CME options open interest is one of the most reliable indicators to measure institutional investor engagement. This metric shows how whales, professional desks, investment funds, and hedgers operate in regulated derivatives markets.
When the number drops this deep, it means that the major players are starting to close their positions completely, usually because they don’t think there are enough attractive short-term prospects to maintain exposure in ETH.
With ETH prices still struggling to stay above $2,000 and institutional investors starting to stay away, the asset is at risk of further pressure throughout April. If the price closes below the $1,912 support, ETH could potentially drop to $1,754.
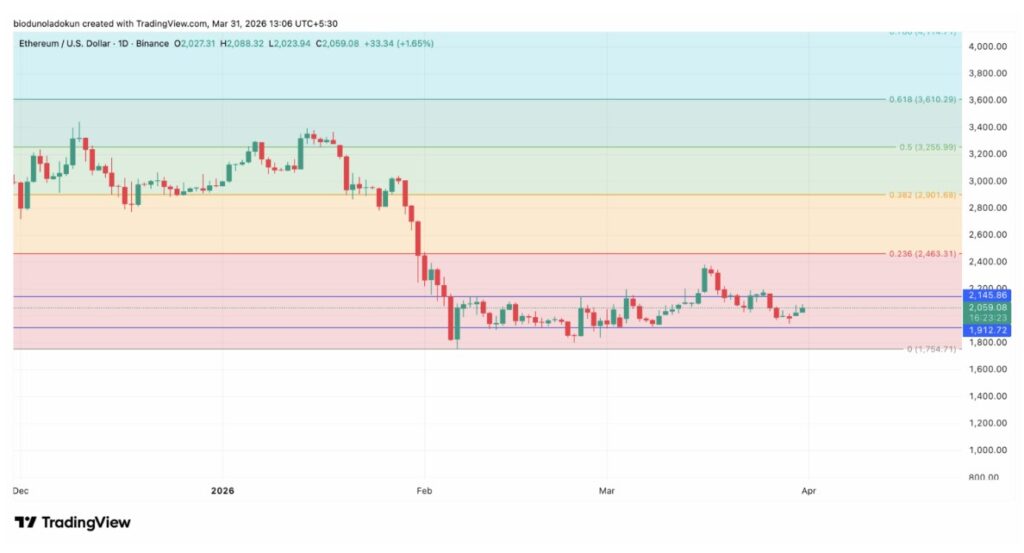
However, if market sentiment improves, ETH still has a chance to break the closing level above $2,145 and continue its rise towards $2,463.
RIVER Surges After Launching at Base, but Bearish Divergence Triggers Correction Risk
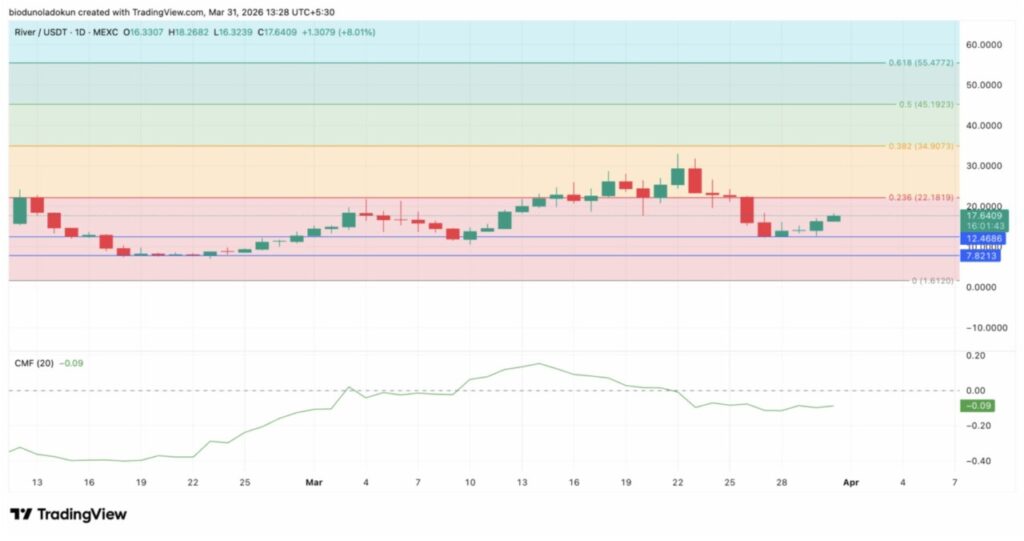
Having previously established a presence on Ethereum and BNB Chain, the River cross-chain stablecoin system officially launched on the Base network on Monday. The launch prompted a surge in demand for its native token, RIVER.
The surge in interest saw RIVER’s price rise 34% in the last 24 hours, making it the highest-gaining asset on the market in that period. However, RIVER’s technical indicator readings point to a potential correction in the near future.
For example, although RIVER has continued to move up in the past four sessions, its Chaikin Money Flow (CMF) indicator is still below zero, forming a bearish divergence. Currently, the momentum indicator-which is used to track capital inflows and outflows-is recorded at -0.09.
A bearish divergence occurs when the asset’s price continues to rise, but the CMF indicator moves downwards. This indicates that the capital flow into the asset is not strong enough to support the price increase.
Read also: As 40% of Altcoins Approach Their Lowest Levels, These 22 Tokens Still Show Strength!
In many cases, divergences like this often precede a pullback phase, meaning RIVER’s short-term momentum could potentially weaken in the near-term.
In that scenario, RIVER could lose some of its recent gains and drop to the $12.46 level. If it fails to maintain that price area as support, the token risks a further slide to $7.82 throughout April. Conversely, if renewed demand comes back into the market, RIVER could gain additional steam and continue its rise all the way to $22.18.
Hyperliquids Record $1.99 Billion Open Interest, but HYPE Price Structure Starts to Bearish
As the US/Israel/Ian conflict continues into April, demand for 24-hour Hyperliquid (HYPE) traded tokenized real-world asset (RWA) perpetual contracts is expected to continue to rise.
This has the potential to push the total daily open interest of HIP-3 even higher than the current record of $1.99 billion.
Read also: Hyperliquid Prices Ready to Rebound? HYPE Tests Important Support as Bullish Signals Strengthen
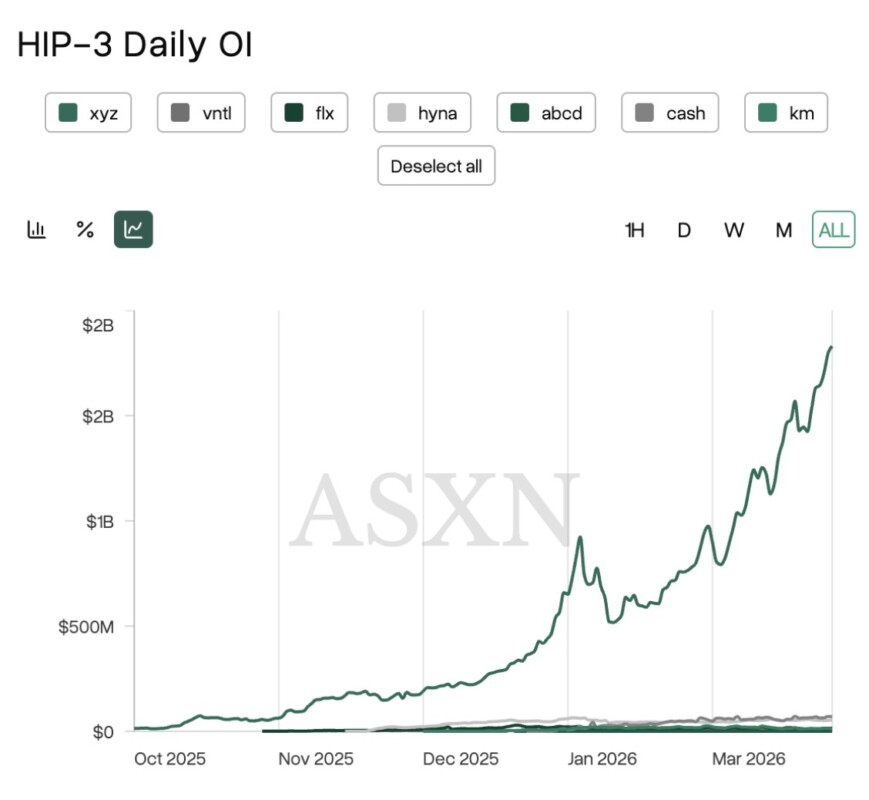
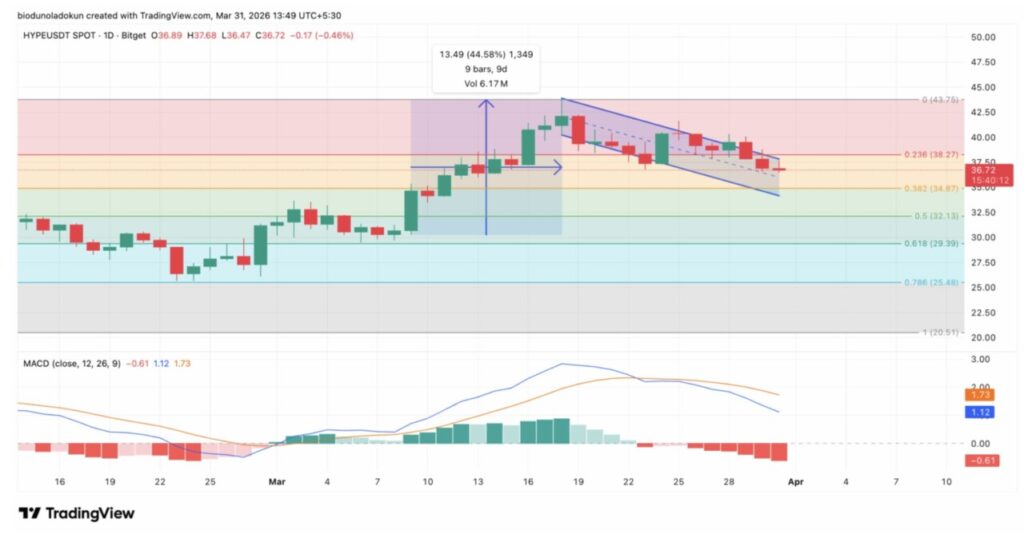
A surge in user activity on Hyperliquid had triggered strong demand for the HYPE token in the first half of March. As a result, the altcoin rose 44% in the period from March 9 to March 18.
However, the momentum is now starting to weaken. After reaching its peak, HYPE is moving in a descending parallel channel pattern, which generally indicates reduced buying pressure and opens up opportunities for further weakness.
This bearish signal is also reinforced by the Moving Average Convergence Divergence (MACD) indicator. Currently, the MACD line is below the signal line, while the red histogram continues to appear and grow in size in recent sessions.
When the MACD structure forms like this, it means that the downward momentum is increasing and sellers are starting to take control of the market.
If the selling pressure gets stronger throughout April, HYPE could potentially drop to $34.87.
Conversely, if accumulation resumes in the HYPE spot market, the price of this asset could break the resistance at $38.27 and continue to rise towards $43.75.
Follow us on Google News to stay up to date with the latest in crypto and blockchain technology. Check Bitcoin price, usdt to idr and tokenized nvidia stock price through Pintu Market.
As a secure crypto app, Pintu provides a crypto trading experience to access crypto gold investment easily and conveniently. You can also see today’ s gold jewelry price and today’s gold bullion price to support your investment activities and portfolio diversification as well as learn crypto through Pintu Academy.
Download the Pintu crypto app via Play Store or App Store now. Enjoy web trading experience with advanced trading tools such as pro charting, various types of order types, and portfolio tracker only at Pintu Pro.
*Disclaimer
This content aims to enrich readers’ information. Pintu collects this information from various relevant sources and is not influenced by outside parties. Note that an asset’s past performance does not determine its projected future performance. Crypto trading activities are subject to high risk and volatility, always do your own research and use cold hard cash before investing. All activities of buying and selling Bitcoin and other crypto asset investments are the responsibility of the reader.
Reference:
- CCN. Three Altcoins to Watch in April 2026: ETH, RIVER, and HYPE Face a Market on Edge. Accessed on April 2, 2026