Market Analysis Dec 4th, 2023: BTC faces its strongest resistance between $39,000 and $41,000

News about a potential Bitcoin spot ETF continues influencing the crypto market, with an expected approval window between January 5 and January 10, 2024. This anticipation has fueled a recent surge in BTC prices, breaching the $41,000 mark and rising 9% in late November. Will the SEC finally greenlight a Bitcoin spot ETF? For more insights, read the detailed analysis below.
As usual, the Pintu trading team has gathered critical information and analyzed the general economic situation and the crypto market’s movements over the past week. However, it should be noted that all information in this Market Analysis is intended for educational purposes, not as financial advice.
Market Analysis Summary
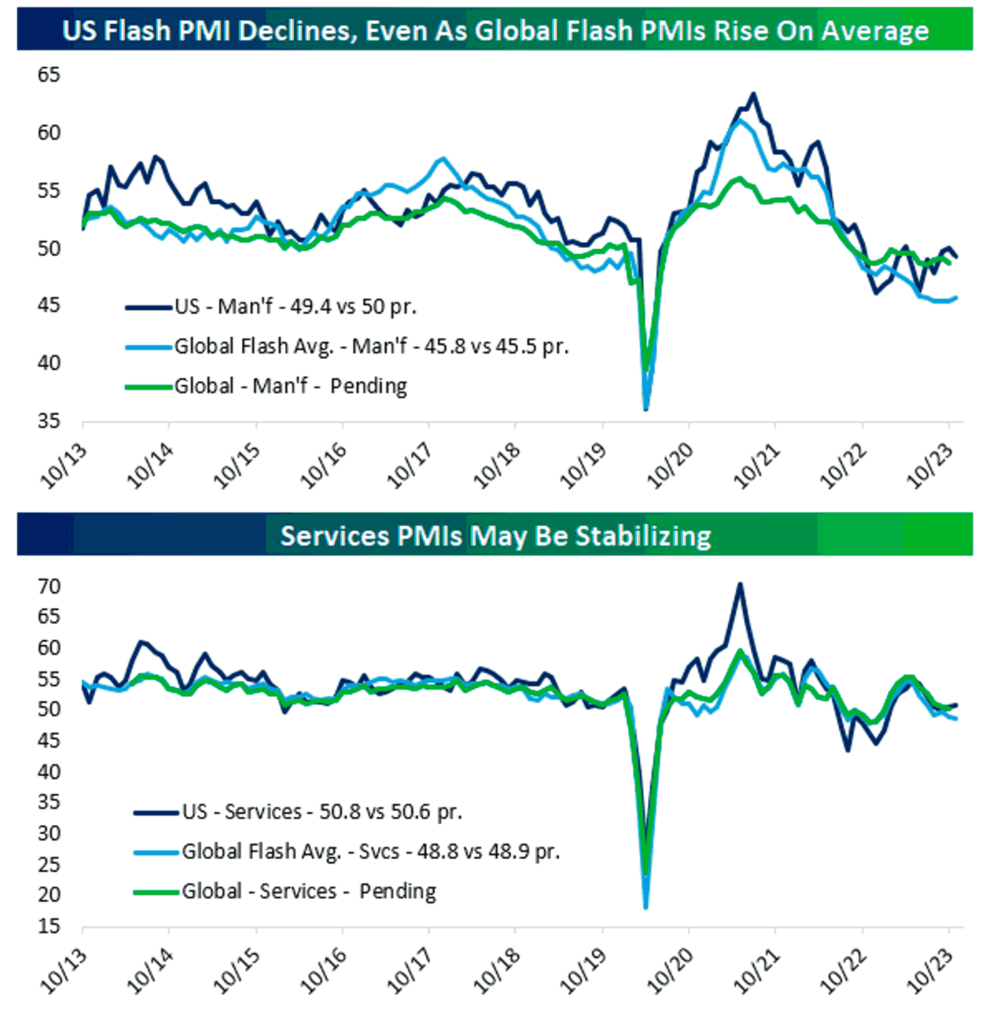
- 🦾 The U.S. economy remained stable in November with a composite PMI index of 50.7, balancing growth in the services sector with a decline in the manufacturing sector.
- 👀 The unemployment rate rose to 3.9% in October, indicating a slowdown that could help the Fed fight inflation.
- 📈 The U.S. international trade deficit increased to $89.8 billion in October, up $3.0 billion from September’s deficit of $86.8 billion.
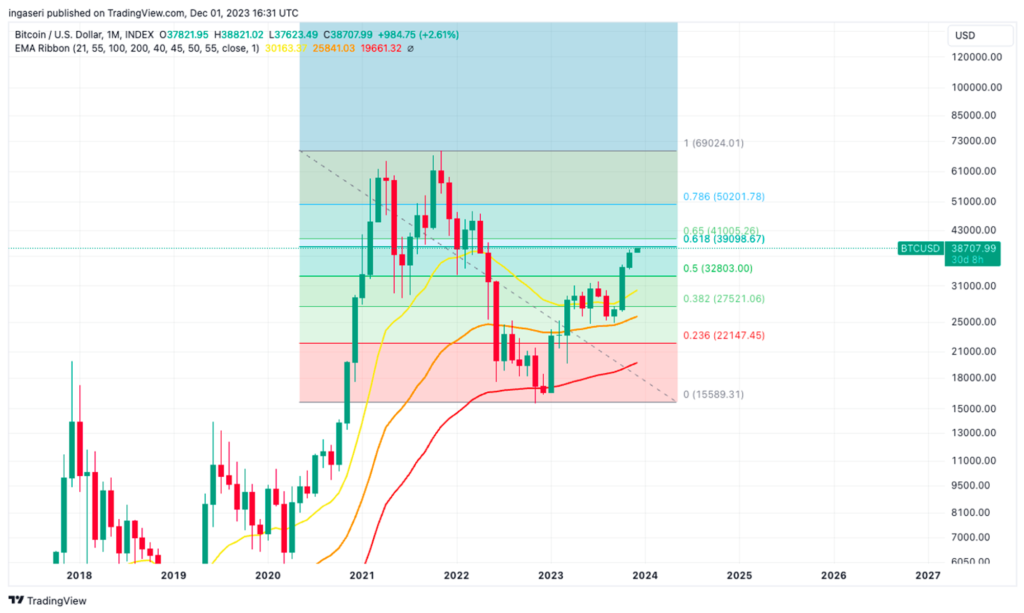
- ✍🏻 BTC is trading in the $38,000-$39,000 range and is poised to meet strong resistance at the golden ratio Fibonacci zone from $39,000 to $41,000.
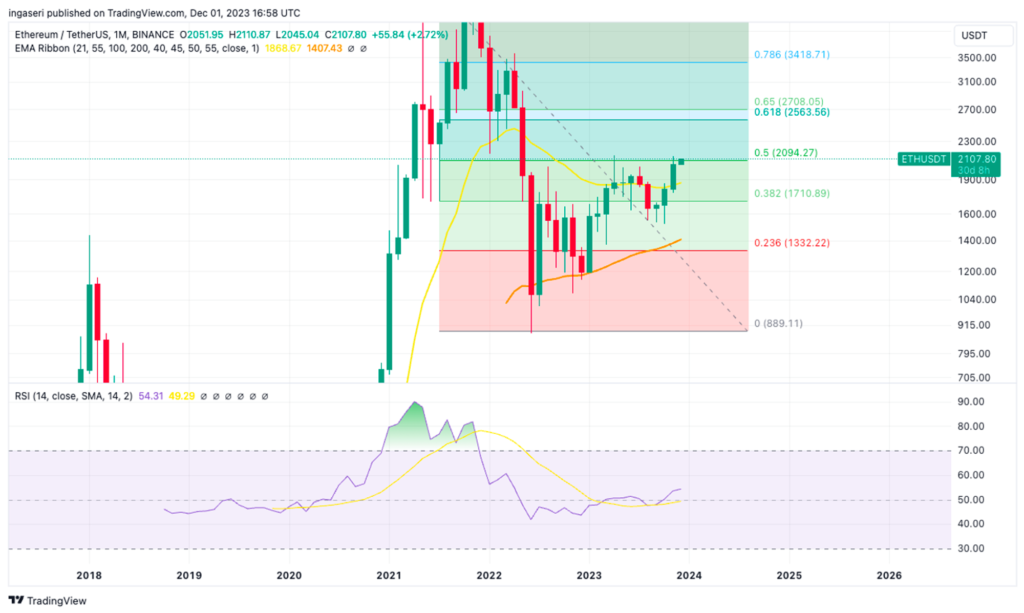
- 💪🏻 ETH’s strongest support is at $2,000, fueling expectations that ETH could break through the $2,100 resistance to a new local high.
Macroeconomic Analysis
S&P Global Manufacturing and Services Index

The U.S. economy showed stability in November, with the composite PMI index at 50.7, balancing growth in the services sector with a decline in the manufacturing sector. However, the period also marked the first decline in employment in the past three years, reflecting a cooling labor market amid the Federal Reserve’s interest rate hikes, which have totaled 525 basis points since March 2022, reaching a range of 5.25% to 5.50%. These trends coincide with an increase in the unemployment rate to 3.9% in October, suggesting a slowdown in the labor market that could potentially help the Fed fight inflation.
Other Economic Indicators
- U.S. New Home Sales: In October, new single-family home sales fell 5.6% to a seasonally adjusted annual rate of 679,000 units amid high mortgage rates, which peaked at an average of 7.79%. The Commerce Department’s report reflects this downturn, consistent with a decline in homebuilder sentiment as mortgage rates approached 8%. However, recent declines in rates to around 7.29% suggest a potential rebound in sales. The average new home price fell to $409,300, a significant 17.6% decline from last year, the largest since 1964, partly due to builder incentives amid a shortage of existing homes.
- Goods Trade Balance: The October international trade deficit increased to $89.8 billion, up $3.0 billion from September’s deficit of $86.8 billion. Goods exports in October were $170.8 billion, down $3.0 billion from September, while imports were nearly unchanged at $260.7 billion.
- U.S. GDP growth QoQ: U.S. GDP grew at an annual rate of 5.2% in the third quarter, following a 2.1% increase in the second quarter, marking the strongest quarter since the fourth quarter of 2007. Despite concerns that this growth could challenge the Fed’s efforts to control inflation, the adjusted GDP figures suggest that the economy is avoiding an outright slowdown. With rising jobless claims and declines in income and personal spending, these trends signal a potential “soft landing” for the economy, in line with the Fed’s inflation control goals.
- Core PCE Index: The U.S. Commerce Department reported that the core personal consumption expenditures price index, excluding food and energy, rose 0.2% in October and 3.5% year-over-year, in line with the Dow Jones consensus and down slightly from September’s 0.3% and 3.7%, respectively. October’s inflation, as measured by personal spending, was in line with expectations, potentially motivating the Fed to keep interest rates stable and even consider cuts in 2024.
- Personal Income: In October, U.S. personal income and spending each rose 0.2% monthly, meeting expectations and indicating consumers’ ability to offset inflation. However, both figures slowed from September’s 0.4% increase in income and 0.7% increase in spending, in line with the Fed’s goal of slowing the economy to facilitate a reduction in inflation.
- Initial Jobless Claims: U.S. weekly initial jobless claims rose slightly to 218,000, an increase of 7,000 from the previous period but below the 220,000 forecast. Meanwhile, continuing claims jumped 86,000 to 1.93 million, the highest level since November 27, 2021, with a one-week lag. The Fed remains on hold, but a shift toward rate cuts seems closer as inflation slows and the labor market weakens faster than expected.
BTC & ETH Price Analysis
BTC
The price of BTC reached its highest point since May 2022, surpassing $38,800. Notably, institutional players such as BlackRock and Grayscale are actively engaging with the SEC to conclude their submissions for spot Bitcoin ETF.
In light of the recent postponements by the SEC, analysts specializing in ETFs have indicated that a potential approval window for one or more spot Bitcoin ETF products is anticipated to be between January 5, 2024, and January 10, 2024.
Anticipation of institutional capital entering the BTC market appears to be reflected in the current BTC price, with recent highs being consistently achieved in the short term. As of the latest update, the Bitcoin price has risen by almost 2% in the last 24 hours . While attributing the price movement to a specific news event is challenging, optimism surrounding the potential approval of Bitcoin ETFs seems to be a significant factor driving recent enthusiasm.
The November monthly candle for BTC concluded with a gain of approximately 9%. Currently situated within the $38,000-$39,000 price range, BTC is poised to encounter robust resistance within the Fibonacci golden ratio zone spanning $39,000 to $41,000.

ETH
ETH appears determined to challenge the resistance at $2,100, a level tested twice since early November, coinciding with the 0.5 Fibonacci retracement resistance level. The current price aligns with last week’s, marking buyers’ last breakout attempt.
The support at $2,000 exhibited strength this week, fostering expectations that ETH might break free from its existing pattern and establish new local highs.
Looking ahead, the momentum remains bullish. Successfully surpassing the current resistance could lead buyers to the next significant target at $2,500.
ETH concluded November with a surge of over 13%, finding robust support at the $2,000 mark.

On-Chain Analysis
- 📊 Exchange: As the exchange reserve continues to fall, it indicates lower selling pressure. Net deposits on exchanges are high compared to the 7-day average. Higher deposits can be interpreted as higher selling pressure.
- 💻 Miners: Miners’ are selling holdings in a moderate range compared to its one-year average. Miner’s revenue is in a moderate range, compared to its one-year average.
- 🔗 On-Chain: More investors are selling at a profit. In the middle of a bull market, it can indicate a market top. Long-term holders’ movement in the last 7 days was lower than the average. They have a motive to hold their coins. Investors are in an anxiety phase where they are currently in a state of moderate unrealized profits.
- 🏦 Derivatives: Long-position traders are dominant and are willing to pay short traders. Selling sentiment is dominant in the derivatives market. More sell orders are filled by takers. As OI increases, it indicates more liquidity, volatility, and attention are coming into the derivative market. The increasing trend in OI could support the current ongoing price trend.
- 🔀 Technicals: RSI indicates a neutral condition. Stochastic indicates an oversold condition where the current price is close to its high in the last 2 weeks and a trend reversal can occur.
News About Altcoins
- Chainlink announces the launch of Staking v0.2. Starting December 7th, eligible LINK token holders will be able to stake up to 15,000 LINK over four days before general access opens. Building on the v0.1 release last December, this latest version aims to enhance the Chainlink ecosystem with greater flexibility through a new unbonding mechanism, improved security through stake slashing for node operators, and a modular architecture for future expansion. It also introduces a dynamic reward mechanism designed to incorporate external reward sources such as user fees, marking a significant step forward in the evolution of Chainlink’s staking capabilities.
News from the Crypto World in the Past Week
- The crypto community eagerly awaits the U.S. Securities and Exchange Commission’s decision on several pending spot Bitcoin ETF applications, with an expected approval date in early January. Despite previous extensions of the deadline and the possibility of rejecting the applications, there is growing optimism among industry leaders like Coinbase CEO Brian Armstrong and JP Morgan analysts. Bloomberg Intelligence ETF analyst James Seyffart suggests that the approval date could fall between January 8 and January 10, considering the SEC’s tendency to avoid announcements on Fridays and weekends. This marks a significant moment for the potential granting of spot Bitcoin ETFs.
- Starknet Foundation addresses airdrop rumors and confirms official criteria to be announced. The Starknet Foundation, responsible for the Ethereum Layer 2 network Starknet, recently addressed airdrop rumors after two early draft screenshots were circulated on social media. These drafts, which appeared on the Starknet website, were part of development testing and not final plans. The foundation confirmed that official airdrop criteria and details will be announced once finalized, and also set a deadline for eligibility. This development comes on the heels of Starknet’s 2022 announcement to issue 10 billion Stark (STRK) tokens to be distributed among the organization, developers, contributors, and the community. Starknet, primarily developed by StarkWare, is a decentralized network implementing a zero-knowledge roll-up solution on Ethereum.
- MicroStrategy Increases Bitcoin Holdings by $600 Million. MicroStrategy, the leading corporate holder of Bitcoin, has increased its BTC portfolio by purchasing approximately 16,130 BTCs valued at approximately $608 million. The company, founded by Michael Saylor, purchased these bitcoins for approximately $583.3 million in cash, or an average of approximately $36,785 per bitcoin. This acquisition brings MicroStrategy’s total holdings to 174,530 BTCs, purchased at an average price of approximately $30,252 per coin, further solidifying its position as a major corporate investor in the cryptocurrency world.
Cryptocurrencies Market Price Over the Past Week

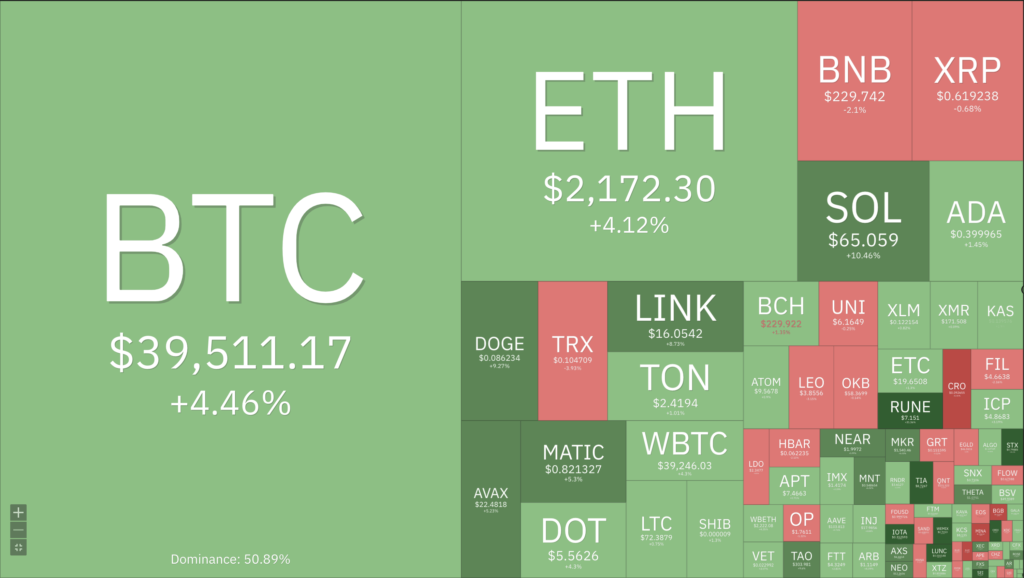
Cryptocurrencies With the Best Performance
- MIOTA +73,96%
- Ordinals (ORDI) +56,29%
- Celestia (TIA) +52,10%
- THORChain +32,20%
Cryptocurrencies With the Worst Performance
- TRON -5,72%
- ApeCoin (APE) -4,06%
- Quant -3,06%
- Blur -2,70%
References
- Chainlink, Chainlink Staking v0.2 Is Now Live, blog.chain.link, accessed on 3 December 2023.
- Vishal Chawla, Starknet Foundation confirms screenshots showing draft airdrop plans, says snapshot already taken, theblock, accessed on 3 December 2023.
- Jamue Crawley, MicroStrategy Bought $600M of BTC in November, Increased Holdings by 10%, coindesk, accessed on 3 December 2023.
- Stacy Elliot, Bitcoin ETF Approval Window Opens Soon—Here Are the Dates to Watch, decrypt, accessed on 3 December 2023.
Share
Related Article
See Assets in This Article
QNT Price (24 Hours)
Market Capitalization
-
Global Volume (24 Hours)
-
Circulating Supply
-


