Understanding the Bitcoin Bull Run Cycle

Price movement cycles are a natural thing in financial markets. The basic principle is that when price increase, they will eventually decrease, and vice versa. This is because investors tend to accumulate assets when prices are low, leading to an increase in price. Then, they sell assets when prices are high, causing a decline.
This pattern can also be observed in the crypto industry, which can be seen from the fluctuation of Bitcoin prices. Bitcoin has experienced three bull run and bear run cycles since it was created in 2009. After a bearish year in 2022, there is a speculation that Bitcoin may be entering the fourth bull run cycle. Learn more about bull run cycles from the following article.
block-heading joli-heading" id="article-summary">Article Summary
- ♻️Bitcoin and crypto assets have a cycle: the bull market-bear market (bottom)-consolidation (sideways).
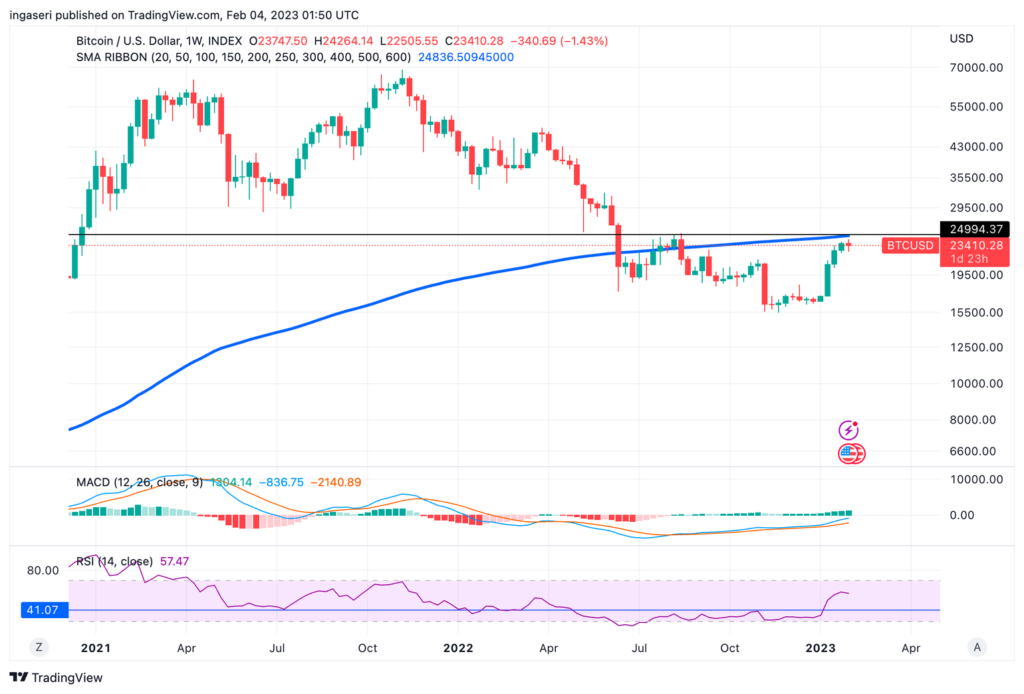
- 🚨 The 200-week MA (US$25,000) is BTC’s strong resistance point. If BTC can break it, the bottom is over, and we are ready for the bull run.
- 📈 A strong positive sentiment is needed for the BTC bull run to occur in the fourth cycle. Some sentiments that might drive the BTC price up are the halving period, adoption of Bitcoin as a mainstream asset, regulation, clarity of Bitcoin ETFs, and investor growth.
- 🪤 However, investors should be mindful that a bull trap could potentially occur during a bull run.
Bitcoin Bull Run History
Bitcoin and other crypto assets have a cyclical pattern based on historical data, consisting of a bull market, a bear market bottom, and a consolidation period where prices move sideways. This cycle has been observed at least three times in the crypto industry.
During the bull run period, the value of Bitcoin rises sharply. Historically, bull run periods have been correlated with Bitcoin halving cycles. The following is the timeline for the Bitcoin bull run period:
First Cycle (2012-2014)
During this period, in 2013 to be precise, BTC’s value surged by 10 times, soaring from US$ 100 to US$ 1,000. This increase is the first period of a bull run in the crypto industry. Not only that, but crypto market capitalization has also increased 160 times, from US$ 75 million to US$ 12 billion in two years.
| Causes of Bull Run | Causes of Bear Run |
| The rise of Bitcoin’s popularity | China bans financial companies from BTC transactions |
| Increased transactions on the crypto exchange | Lots of news and negative sentiment (Fear Uncertainty and Doubt) |
| Growing demand for BTC from China |
However, after breaking US$ 1,000, the BTC price didn’t take long to enter a bear run period instantly. During the bear run period in the first cycle, BTC continued to fall back to around US$ 200.
Also, read the following articles about bull and bear in the crypto markets
Second Cycle (2016-2018)
Between 2014 and 2016, the value of BTC remained within the US$ 200 to US$ 500 range, without any significant upward or downward movements. Towards the end of 2016, BTC’s price began to show a positive trend, climbing gradually to reach the US$ 1,000 range. After breaking the highest level in the first cycle, the BTC price skyrocketed until it reached US $ 19,000. Inevitably, this period became the second Bitcoin bull run.
| Causes of Bull Run | Causes of Bear Run |
| The increasing of crypto exchanges and the emergence of leverage features | The hack on the Japanese exchange, Coincheck, which caused losses of up to US $ 530 million |
| In 2017, 966 new tokens were created through an initial coin offering (ICO) with a total value of US$10 billion. | Facebook and Google banned ICO advertising and token sales on their platforms. |
| The adoption and implementation of stablecoins, alongside the growth of Ethereum and its smart contract technology. | The US Securities and Exchange Commission (SEC) denied the registration of BTC Exchange Traded Funds (ETF). |
However, similar to the first cycle, the price of BTC entered a bear run period after reaching its all-time high during the second cycle. Throughout 2018 the BTC price continued to fall until it returned to the US$ 3,000 – US$ 5,000 area. This bear run period is also known as crypto winter.
Third Cycle (2020-2022)
After experiencing a bear run, the BTC price consolidated throughout 2018-2020. In fact, during the consolidation phase, the crypto industry continues to grow. Various Decentralized Finance (DeFi), Non-Fungible Token (NFT) projects, and GameFi started to emerge and continue to be developed.
Following the consolidation phase between 2019-2020, the value of Bitcoin started to climb. The price of Bitcoin skyrocketed from US $ 13,000 to US $ 69,045. This level is also the highest level of Bitcoin of all time.
| Causes of Bull Run | Causes of Bear Run |
| Various DeFi projects are starting to be recognized. Thanks to the technology and innovation offered and a clear business model. | Worsening macroeconomic conditions as inflation skyrocketed |
| NFT and GameFi is booming, with more retail investors getting involved. | Aggressive monetary policies drive investors to avoid risky assets like Bitcoin. |
| Institutional investors and banks are accepting Bitcoin as an investment. | Problems in the crypto industry itself, such as the fall of LUNA and the bankruptcy of Celsius, 3AC, and FTX |
Bitcoin’s price dropped due to macroeconomy and crypto industry issues, leading to a prolonged bear run. The fall persisted until November 22, 2022, when it reached its lowest point of $15,195.
Intrigued by the DeFi industry and interested in using it? Read how to do it in the following article.
Has the Bottom Been Touched?
After plunging to around US$ 15,195 in November 2022, the value of BTC remained relatively stable. BTC ended 2022 at US$16,569. However, in 2023, the price was in a positive trend and started moving up. When this article was written, the BTC price was US$ 23,212, up 28.62% from the end of 2022. With this positive trend, has BTC reached its bottom level and ended the bear run period?
From a technical perspective, Pintu’s team trader believes the biggest hurdle is still the 200 weeks MA, which is at a 25K price point. We still need to break above the historically strong support (now resistance) to confirm that we are ready for the bull run and that the bottom is over. Currently, BTC supports 22,500 and 20,000. Meanwhile, for resistance at 24,000 and 25,000.
A breakout is a condition in which the price movement of an asset manages to pass a resistance point and continues to move upwards until it reaches the next resistance point.

Besides from technical indicators, let’s look at some of the indicators below to get answers to those questions:
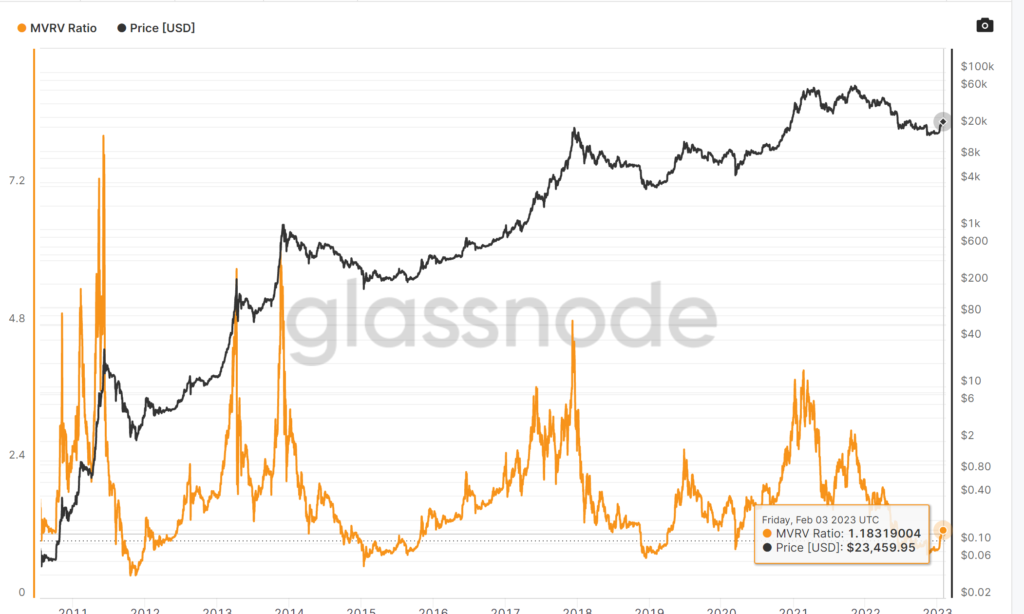
- Market Value to Realized Value (MVRM). The MVRV indicator is used to calculate the ratio between the actual valuation and the realized valuation. If the MVRV value is greater than two, the asset is overvalued. The asset is undervalued if MVRV is in the 0-1 range. The chart below shows that the MVRV ratio has moved above level 1, at 1.18, to be precise. This is the first time since 200 days ago that MVRV has broken out above level 1. Signaling that Bitcoin is no longer undervalued.

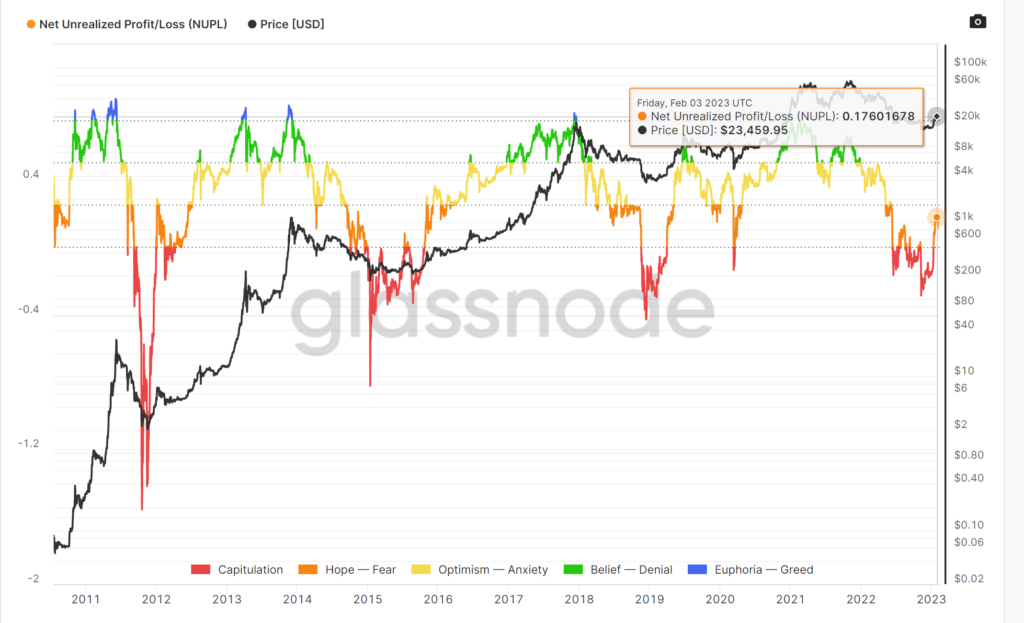
- Net Unrealized Profit and Loss (NUPL). NUPL is an indicator that shows asset holders’ profit and loss levels. If the NUPL is below 0, more asset holders are losing money. If the NUPL is above 0, then more asset holders are profitable. Bitcoin’s NUPL is currently being tracked at 0.18, showing that most BTC holders are no longer in losing positions.

You can find out more about on-chain analysis in the following article
Are We Witnessing the Fourth Cycle?
If we look at the historical data, every bull run phase will be followed by a bear run. These two phases already occurred in the third cycle. So are BTC and other crypto assets currently in a consolidation phase?
During a consolidation phase, the price of BTC may experience a temporary boost, but a subsequent drop could follow it.
During the first cycle, BTC’s consolidation lasted from late 2014 to mid-2016, with prices ranging from US$ 325 to US$ 450. The second cycle saw BTC prices fluctuate between US$ 3,000 to US$ 6,000 over two years. Meanwhile, in the third cycle, after declining to US$ 30,000 in mid-2022, BTC’s price has traded in the range of US$ 15,000 – US$ 23,000 over the past eight months.
Unfortunately, no one can predict how long this consolidation phase will last. The recent strengthening of BTC’s price from US$ 15,000 to US$ 23,000 doesn’t necessarily indicate an impending fourth cycle of a bull run. Historically, various significant positive catalysts are needed to trigger a bull run.
During the previous consolidation phase, the crypto industry always experienced significant developments. Currently, the industry is focused on adopting layer-2 technology to solve scalability problems. Ethereum, the second largest blockchain and home to many DApps, is also preparing a Shanghai upgrade to improve scalability.
On the development of layer-2 technology, read here.
Factors that Can Drive the Bull Run
Below are several potential catalysts that may have a positive impact on the upcoming bull run:
- ⚒️Bitcoin halving. Historically, bull runs have usually coincided with halving periods. The 2012 halving period was the start of the first bull run cycle. Likewise, the 2016 and 2020 halving periods started the second and third cycles of bull runs, respectively. Meanwhile, the next BTC halving period will occur in 2024.
- 🏢Institutional investor participation. In the last bull run, institutional investors played a crucial role in driving up the price of BTC. If BTC becomes more mainstream, it could attract more institutional investors. It will lead to increased trust and more funds flowing in, potentially causing the price of BTC to rise.
- ⚖️Clear and well-defined regulations. It is considered that the urgency of tightening regulations will get stronger after the FTX, 3AC, and Celcius situation. Stricter regulations could positively impact the long term. With investors protected by tighter laws, it is possible that investors who were hesitant before will be interested in entering the crypto market.
- 💼 Bitcoin ETF Legality. Grayscale, the world’s largest digital asset manager, still needs to work on seeking SEC approval to launch a Bitcoin ETF. So far, the SEC is still adamant about rejecting Grayscale’s application. One of the reasons for the SEC’s refusal is that there is no regulation regarding crypto assets. The Bitcoin ETF is expected to attract more retail and institutional investors, transforming the industry’s landscape if approved.
- 🆙 The Growth of Investor. The rise in BTC prices is related to an increase in crypto investors. The Coinbase report predicts greater interest in established assets like BTC and ETH. This is due to factors such as tokenomic, sustainability, ecosystem maturity, market liquidity, and failed crypto projects in 2022.
Beware of Bull Trap

Periods of rising BTC prices cannot always be interpreted as bull runs. In the crypto world, there is a term called bull trap. Bull traps is a false signals that occur amid an asset experiencing a downward trend, where a temporary price increase manages to break through the support point, but the price falls back. This ultimately “trapped”traders or investors who placed long positions when they saw that the asset had broken the support point. So, instead of continuing to go up, the price weakened and went down, resulting in losses for traders and investors.
Investors or traders can look for confirmation through several technical indicators and divergence patterns to minimize being trapped by a bull trap. For example, you can look at trading volume levels or look for bullish candlestick patterns after a breakout. These two things can be used to confirm whether the price might continue to move up or a bull trap will occur. A breakout accompanied by low volume and a questionable candlestick such as a doji star could be a sign of a bull trap.
Apart from bull traps, there are also bear trap situations that are the opposite. A bear trap occurs when the price of an asset experiences a correction amid an uptrend. The bear trap "trapped" traders who want to take advantage of the downtrend situation by opening short positions. So, when the downtrend is over and the price back to an uptrend, traders who open short positions will be trapped and end up losing money.
Find out how to do technical analysis to avoid bull traps in the following article.
Buy Bitcoin at Pintu
Regardless of what will happen to Bitcoin in the future, you can start your investment in BTC through Pintu. At Pintu, you can invest in various crypto assets such as ETH, SOL, BNB, and others safely and easily.
Pintu is also compatible with popular wallets such as Metamask to facilitate your transactions. Download Pintu app on Play Store and App Store! Your security is guaranteed because Pintu is regulated and supervised by Bappebti and Kominfo.
In addition to executing transactions, in the Pintu Apps, you can also learn more about crypto through various Pintu Academy articles which are updated every week! All Pintu Academy articles are made for knowledge and educational purposes, not as financial advice.
Referensi
Chris Collar, Bitcoin and Ethereum May Have Found Their Market Bottoms, Messari, accessed on 8 February 2023
Bybit Learn, When Is The Next Crypto Bull Run? Bybit, accessed on 8 February 2023.
Nivesh Rustgi, Bitcoin on-chain and technical data begin to suggest that the BTC price bottom is in, Coin Telegraph, accessed on 8 February 2023.
Stan Higgins, 2013 to 2017: Comparing Bitcoin’s Biggest Price Rallies, Coindesk, accessed on 9 February 2023.
Nikolai Kuznetsov, A little bit of history repeating? The numbers behind Bitcoin’s bull run, Coin Telegraph, accessed on 9 February 2023.
Samuel Sherwood, A Brief History of China FUD, Exodus, accessed on 8 February 2023.
Helen Partz, A brief history of Bitcoin crashes and bear markets: 2009–2022, Coin Telegraph, accessed on 9 February 2023.
Brian Nibley, Bitcoin Price History: 2009 – 2023, Sofi Learn, accessed on 8 February 2023.
James Chen, What is a Bear Trap? Investopedia, accessed on 10 February 2023.
James Chen, What is a Bull Trap? Investopedia, accessed on 10 February 2023.
Chris Collar, Has the Next Bull Cycle Begun for Bitcoin and Ethereum? Messari, accessed on 10 February 2023.
Share


