Market Analysis Nov 11th, 2024: Trump wins election, BTC hits new ATH, Solana outperforms BNB!

Donald Trump’s victory as the 47th President of the United States was a great moment for global crypto investors, driving Bitcoin (BTC) to reach an all-time high (ATH) while altcoins and even memecoins saw significant gains. What other catalysts could push BTC even higher? Check out the analysis below.
Market Analysis Summary
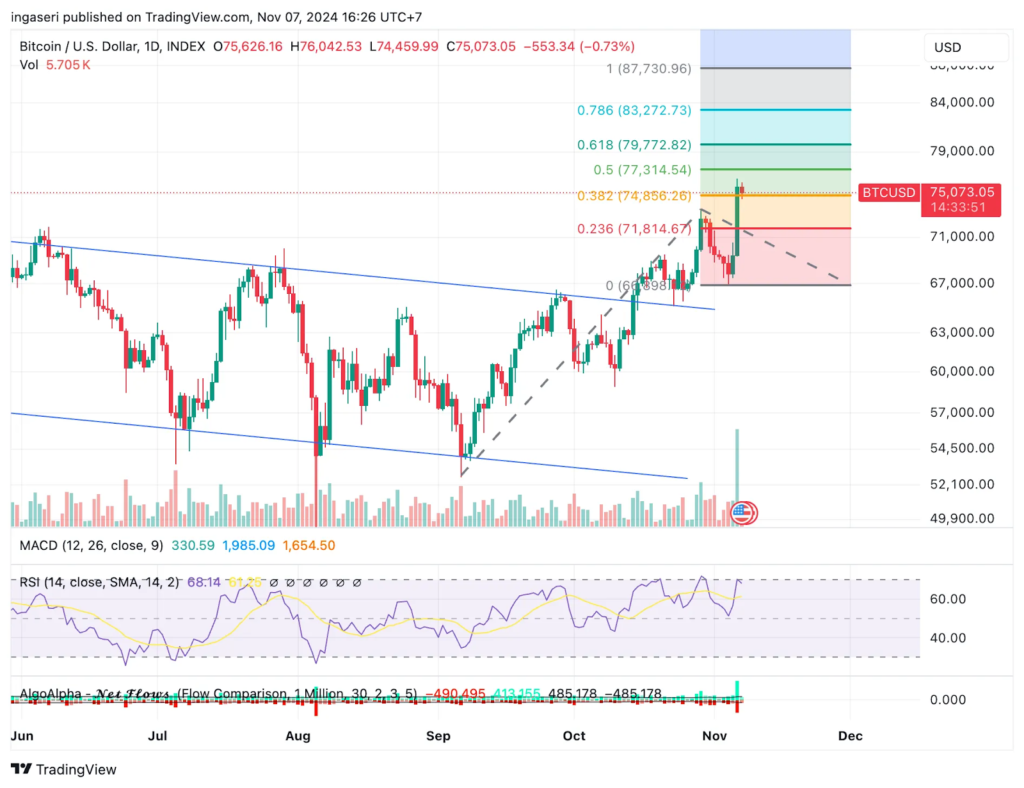
- 📝 BTC shows support at $74,856 and a key resistance level to surpass is $77,300.
- 📉 The latest U.S. nonfarm payroll data revealed unexpectedly sluggish job growth, sparking market speculation.
- 🟢 Unemployment rate held stead at 4.1%.
- 💼 The seasonally adjusted S&P Global U.S. Services PMI® Business Activity Index indicated sustained robust growth in service sector output for October, easing slightly to 55.0 from 55.2 in September. Activity has now increased for 21 consecutive months.
Macroeconomic Analysis
Non-Farm payrolls
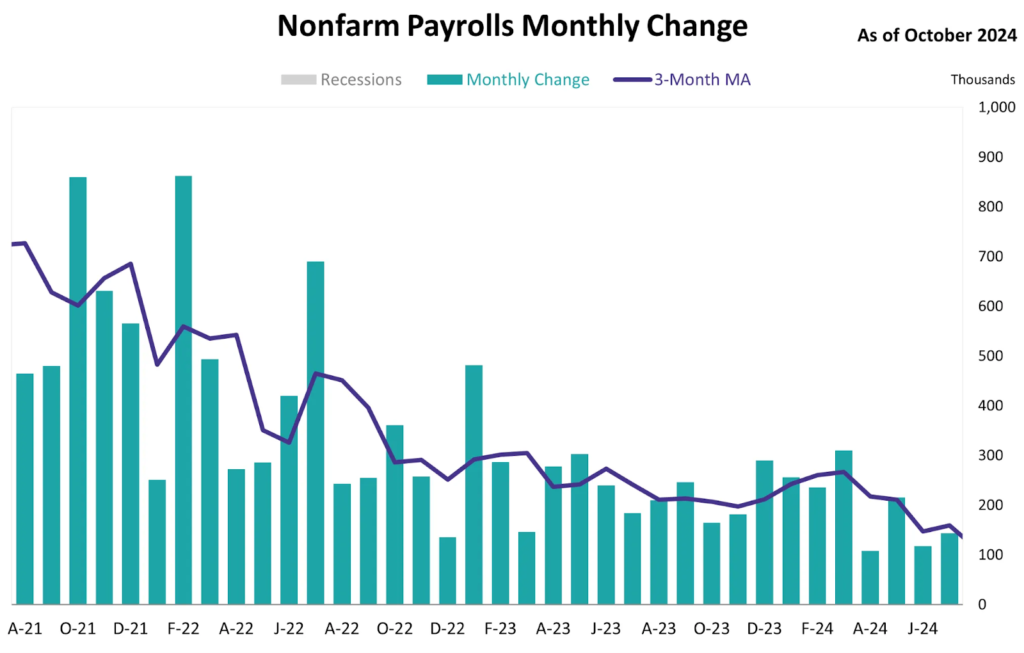
The latest U.S. nonfarm payroll data revealed unexpectedly sluggish job growth, sparking market speculation. In October, nonfarm payrolls rose by just 12,000 jobs—a steep drop of 211,000 compared to the previous month and significantly lower than the forecasted 110,000. The unemployment rate held steady at 4.1%, unchanged from the prior month.

The sharp decline can largely be traced to the effects of Hurricane Milton, the Boeing strike, and the Bureau of Labor Statistics (BLS) survey method. According to the BLS, its establishment survey only considers individuals as employed if they received a paycheck during the week of the 12th each month. By contrast, the household survey counts individuals as employed even if they missed a paycheck that week due to weather disruptions or leave.
Hurricane Milton, which made landfall in Florida on October 9, coincided with the establishment survey period. Consequently, workers unable to receive a paycheck during the week of October 12 due to weather-related work stoppages were not counted as employed, contributing significantly to October’s steep drop in nonfarm payroll figures.
Unemployment Rate
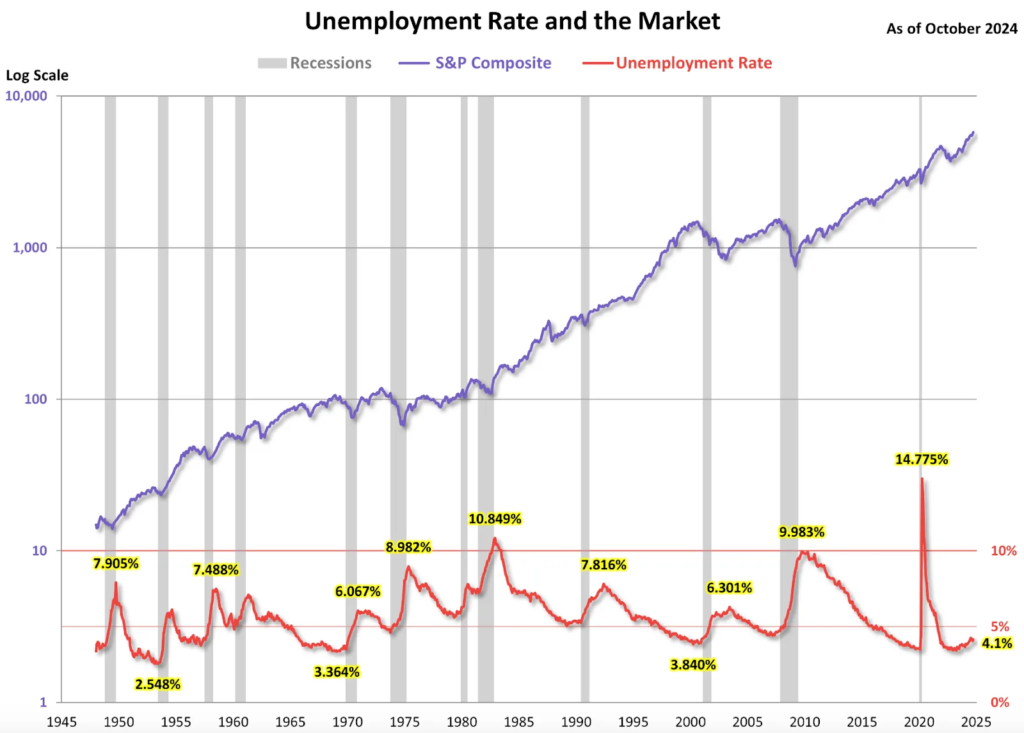
The following chart below illustrates the trends in unemployment, recessions, and the S&P composite since 1948. Unemployment typically acts as a lagging indicator, moving inversely to equity prices. Notice the rising unemployment peaks in 1971, 1975, and 1982, which mirror previous bear markets. During the COVID-19 pandemic, this inverse relationship between equities and unemployment briefly reappeared, though the effect was short-lived as market optimism quickly resurged. Currently, the unemployment rate stands at 4.1%

Other Economic Indicators
- S&P Manufacturing PMI: US S&P Global final October manufacturing PMI is at 48.5 vs 47.8 consensus. The downturn in U.S. manufacturing extended into its fourth consecutive month in October, setting a discouraging tone for the goods-producing sector as the fourth quarter begins. Although the decline rate slowed, order books continued to shrink at an alarmingly fast pace, and an increase in unsold stock suggests potential further production cuts in the months ahead unless demand improves.
- ISM Manufacturing Index: U.S. manufacturing activity continued to decline at a faster rate in October, with the ISM Manufacturing PMI dropping to 46.5 from 47.2 in September, falling short of the market forecast of 47.6. The Employment Index in the PMI survey saw a slight increase, rising to 44.4 from 43.9, while the Prices Paid Index jumped significantly to 54.8 from 48.3. Meanwhile, the New Orders Index showed some improvement, climbing to 47.1 from 46.1.
- ISM Service Index: The Institute of Supply Management (ISM) has published its October services purchasing managers’ index (PMI), with the composite index rising to 56.0, surpassing the forecast of 53.8. This latest reading marks the index’s return to expansion territory for the 50th time in the past 53 months.
- S&P Services PMI: The seasonally adjusted S&P Global U.S. Services PMI® Business Activity Index indicated sustained robust growth in service sector output for October, easing slightly to 55.0 from 55.2 in September. Activity has now increased for 21 consecutive months.
BTC Price Analysis
BTC has hit a new all-time high of $75,358, marking a significant milestone in the cryptocurrency’s 15-year history.
The price surge followed the announcement of former U.S. President Donald Trump’s re-election as the 47th President of the United States. Within 24 hours, Bitcoin experienced a sharp 10% increase before a slight correction.
Cryptocurrency investors have funneled over $200 billion into various digital assets within the last 24 hours following Trump’s victory in the recent U.S. elections. Major digital currencies have seen substantial gains.
The total market capitalization of all crypto assets surged to $2.652 trillion. BTC hit a record price and has gained 3.42% over the past week. With a market cap of $1.4 trillion, Bitcoin’s market dominance remains steady at 57%.
Altcoins also recorded impressive returns as fresh capital flowed into the sector. Solana’s SOL has overtaken Binance’s BNB to become the fourth-largest cryptocurrency by market capitalization. Solana now ranks just behind Bitcoin, Ethereum, and stablecoin Tether, with a market cap of $88.7 billion.

Using Fibonacci extension, BTC shows support at $74,856; a break below this level could signal a potential decline to the $71,000 range. On the upside, a key resistance level to surpass is $77,300.
On-Chain Analysis
- 📊 Exchange: As the exchange reserve continues to fall, it indicates lower selling pressure. Net deposits on exchanges are high compared to the 7-day average. Higher deposits can be interpreted as higher selling pressure.
- 💻 Miners: Miners’ are selling holdings in a moderate range compared to its one-year average. Miner’s revenue is in a moderate range, compared to its one-year average.
- ⛓️ On-chain: More investors are selling at a profit. In the middle of a bull market, it can indicate a market top. Long term holders’ movement in the last 7days were higher than the average. If they were moved for the purpose of selling, it may have negative impact. Investors are in a belief phase where they are currently in a state of high unrealized profits.
- 🏦 Derivative: Long position traders are dominant and are willing to pay to short traders. Buying sentiment is dominent in the derivatives market. More buy orders are filled by takers. As OI increases, it indicates more liquidity, volatility, and attention are coming into the derivative market. The increasing trend in OI could support the current ongoing price trend.
- 🔀 Technicals: RSI indicates a neutral condition. Stochastic indicates a neutral condition where the current price is in a moderate location between the highest-lowest range of the last 2 weeks.
News About Altcoins
- Solana Surpasses BNB as Fourth-Largest Crypto. Solana (SOL) has overtaken Binance Coin (BNB) to claim the fourth spot among cryptocurrencies by market capitalization. This surge follows a 15.4% increase in the past 24 hours, pushing SOL’s price to $185.30 and its market cap to $87.3 billion. SOL’s strong performance extends beyond the past day. The cryptocurrency has seen a 24% increase over the past month and a 2.2% gain over the past week, outperforming the broader crypto market. In contrast, BNB, despite a 3.9% increase, trails SOL by approximately $2.5 billion in market capitalization.
News from the Crypto World in the Past Week
- BlackRock’s Bitcoin ETF Outshines Gold ETF. BlackRock’s iShares Bitcoin Trust (IBIT) has surpassed the iShares Gold ETF (IAU) in terms of net assets, reaching $33.17 billion compared to IAU’s $32.9 billion. This milestone comes as IBIT, which began trading in January 2024, set a new record with daily net inflows of $1.1 billion on November 7th. The surge in institutional investment into the crypto market, particularly Bitcoin, has been fueled by factors such as Trump’s victory and the Fed’s interest rate cut. This trend is expected to continue, driven by pro-crypto regulations and potential economic stimulus from China. IBIT has emerged as one of the most successful ETF launches in history, attracting a total of $25.5 billion in net inflows since the start of the year.
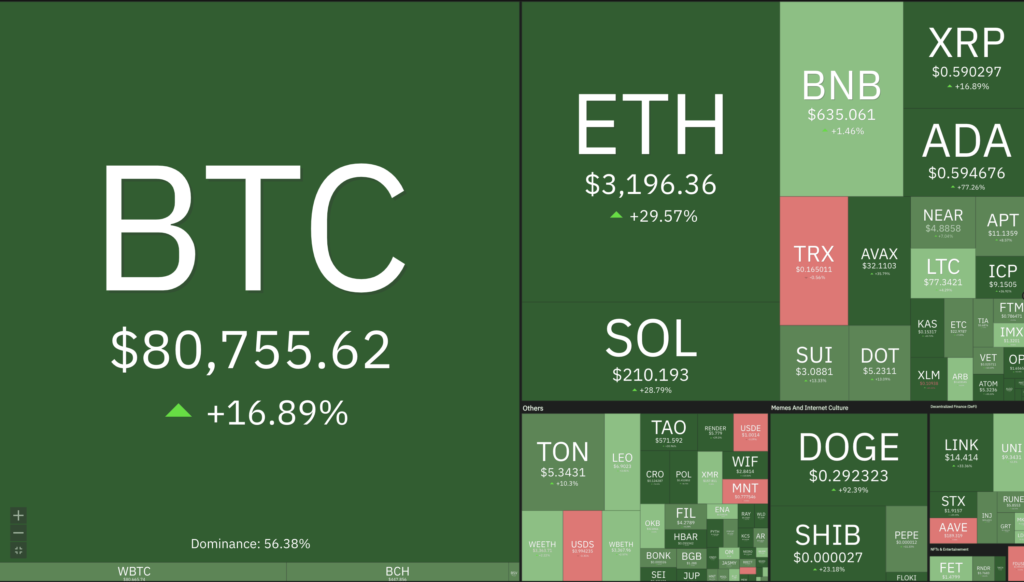
Cryptocurrencies Market Price Over the Past Week

Cryptocurrencies With the Best Performance
- Neiro (First Neiro On Ethereum) +100,68%
- Dogecoin (DOGE) +91,54%
- Cardano (ADA) +77,35%
- Raydium (RAY) +65,59%
References
- Jason Shubnell, BlackRock’s bitcoin ETF has surpassed its gold ETF in net assets just months after debut, theblock, accessed on 9 November 2024.
- Wayne Jones, Solana Tops BNB, Rises to Become 4th-Largest Crypto Asset By Market Value, Cryptopotato, accessed on 9 November 2024.
Share


